Best Low Volatility ETFs: QLV, TDVG & CGBL Reviewed by a CFA Charterholder
About this article: This article is based on Ethan’s video, originally published on October 14, 2026. Because the written version was published later, returns, yields and fund details reflect data available at the time of the video and have likely changed since. Please check each fund’s website for current figures.
Factor Investing Series: you’re reading Part 11 of 11
Part 1: Momentum Investing Explained
Part 2: SPMO vs MTUM
Part 3: Small-Cap Investing Explained
Part 4: Top Small-Cap ETFs
Part 5: Value vs Growth Stocks
Part 6: Best Value ETFs
Part 7: Quality Factor Investing Explained
Part 8: Top International Quality ETFs
Part 9: Top U.S. Quality ETFs
Part 10: Minimum Volatility Investing Explained
Part 11: Best Low Volatility ETFs (you’re here)
We’ve finally made it. This is the last part of our series on factor investing, and in this one I’m covering my top low volatility factor ETF, plus two compelling alternatives for investors who want to add a bit of safety to their stock portfolio.
The Short Version
QLV is my top low volatility factor ETF: it pairs quality with low volatility and costs just 0.08% a year.
TDVG (T. Rowe Price Dividend Growth) is for investors who want some downside protection but still want to participate in the upside.
CGBL (Capital Group Core Balanced) is for investors who want more potential downside protection and a long, proven track record in a similar strategy.
What Is Minimum Volatility Investing?
If you want the deeper dive, it’s in the previous part of this series. The two-sentence version: minimum volatility investing tries to improve risk-adjusted returns by finding stocks that reduce a portfolio’s risk by more than they reduce its returns. Most factor-based ETFs do that by simply screening for the companies that have been the least volatile over some past time frame, with some variation in how they go about it.
It’s not that sophisticated, but it has historically worked, if a lower risk, lower reward profile is what you’re going for.
In the last part we used SPLV and USMV as examples because they’re the two largest min vol ETFs. But they’re not my top picks.
My Top Low Volatility ETF: QLV
That would be QLV, the Northern Trust US Quality Low Volatility ETF. And the order of those words matters. I’m not sure anyone would want the low quality volatility ETF.
Oh wait, that pretty much exists. The Invesco S&P 500 High Beta ETF (SPHB) tracks the 100 S&P 500 stocks with the highest market sensitivity. And there’s even a 3x leveraged version of it (HIBL). Beta is a measure of volatility, so these are basically looking for companies that have been really volatile, and in the second case, levering that up three times. No thank you.
Back to QLV, which focuses on high quality and low volatility, essentially pairing the last two factors in this series together. I like it for three reasons.
1. Quality and Low Volatility Are a Great Pairing
If you need a refresher, quality is a factor that looks at consistency of earnings growth and the things that show a company can sustain its earnings over time: low debt, strong cash flows and so on. Historically, quality companies have often held up better than the overall market in downturns. But the quality factor tends to find different kinds of companies than the low volatility factor does.
A quality company might be one with a strong position in a growing industry, like Microsoft. But high-quality companies aren’t always cheap, and companies with high valuations can be volatile if they’re priced for perfection and something goes wrong. Low volatility companies, on the other hand, are often boring utilities and consumer staples — think very stable businesses like Coca-Cola or McDonald’s — that might not offer a ton of growth potential. Put them together and you get a really nice marriage.
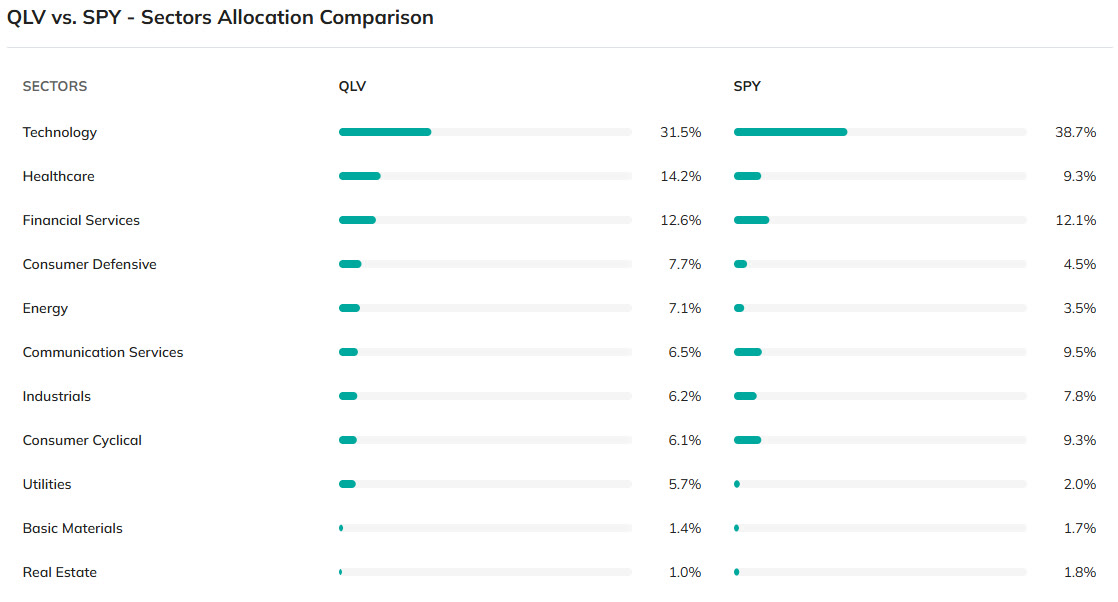
QLV’s sector weights stay close to the S&P 500 (SPY), thanks to guardrails that keep it from straying too far from the benchmark.
2. It’s the Cheapest Low Volatility ETF I Could Find
QLV charges just 8 basis points (0.08%) a year. That’s cheaper than SPY.
3. It’s Easy to Diversify Globally
QLV has a developed non-U.S. markets version (QLVD) and an emerging markets version (QLVE), which makes it easy to stay geographically diversified and should help lower the volatility of an overall portfolio. We focus a lot on single funds, but how you combine them matters too. Portfolios built so that not every part depends on the same things going well tend to hold up better when things don’t go well.
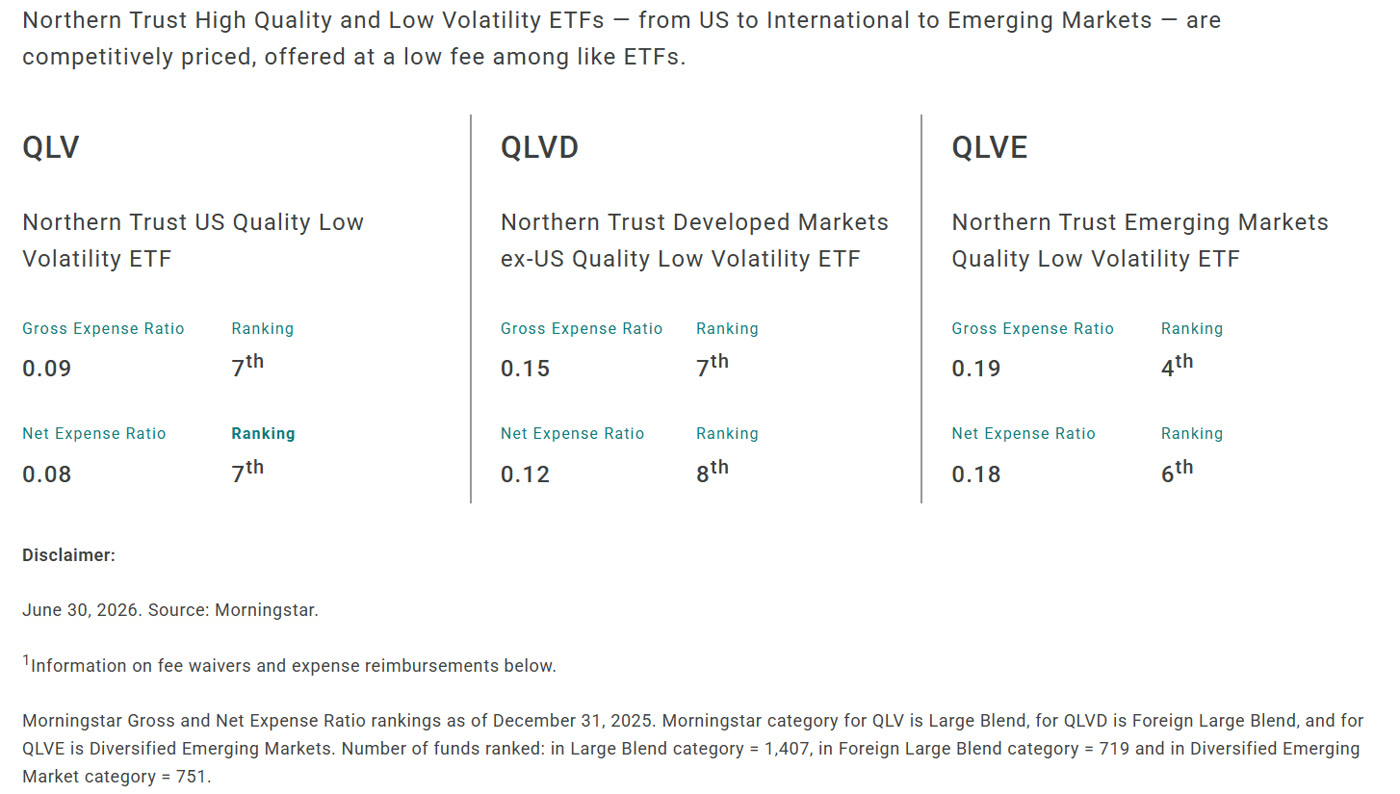
QLV’s international siblings, QLVD and QLVE, keep the same approach at similarly low cost.
The combination of quality and low volatility, plus guardrails to keep it close to the benchmark, gives investors a chance to limit downside risk without giving up as much upside as purer min vol ETFs like SPLV.
How QLV Has Held Up in Downturns
QLV has only been around since 2019, so there aren’t many downturns to show, but here’s what we have, compared with SPLV, USMV and SPY (the S&P 500).
The 2020 COVID Crash
I consider 2020 an anomaly. Many generally stable businesses were forced to shut down, while many generally risky businesses saw years of growth packed into a few months if they sold anything digital. That’s unlikely to repeat. None of the low volatility ETFs protected particularly well on the downside, and they all trailed in the recovery. I would normally expect all of these to trail in recoveries, but they should also lose less in major down markets the vast majority of the time. Worth noting: QLV didn’t recover as strongly as the S&P, but it did recover better than the other low volatility ETFs.
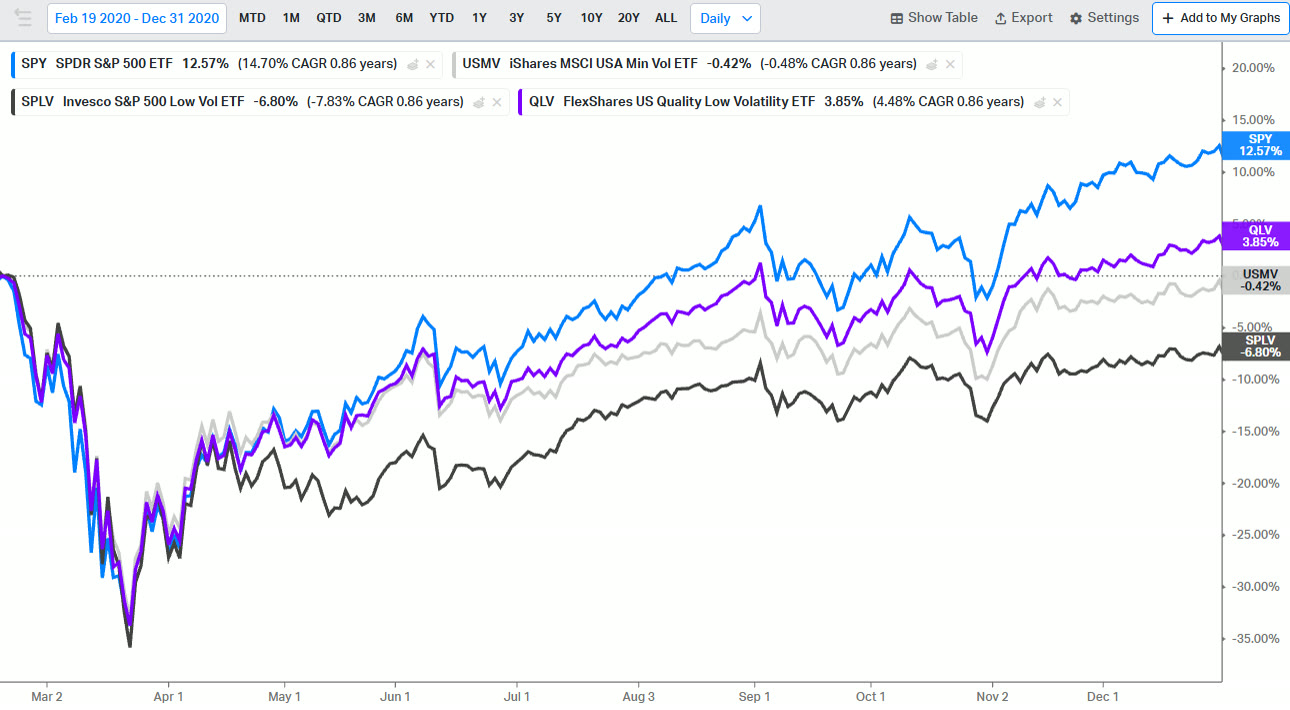
2020: none of the low volatility ETFs protected much on the way down, and QLV recovered best of the three.
The 2022 Bear Market
In 2022, QLV was nearly identical to USMV, which uses similar constraints to keep broad, market-like sector exposure. It did worse than SPLV, which has no sector constraints, so it tends to be more concentrated in a few areas with more exposure to lower volatility companies. SPLV typically loses the least in downturns, but also recovers the least on the other side. There’s nothing wrong with that, but I think one of the funds below is arguably a better alternative.
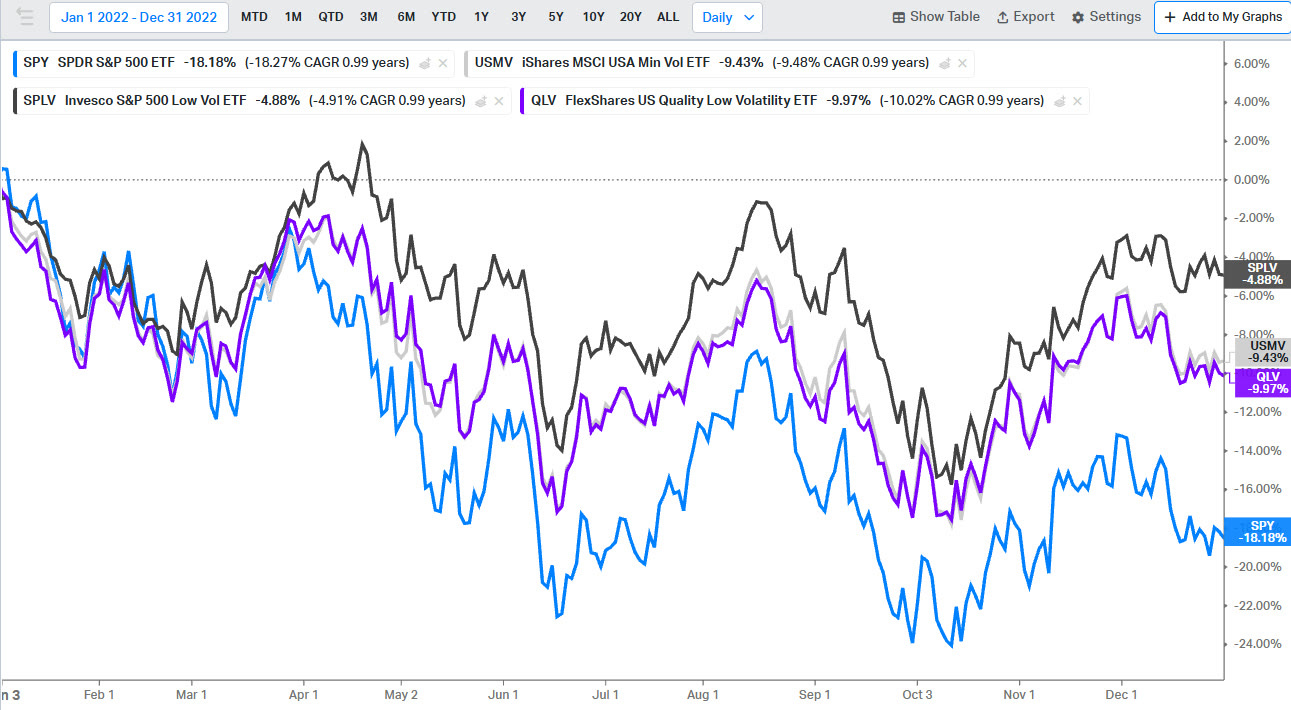
2022: all three beat the S&P 500, and SPLV held up best.
The 2025 “Liberation Day” Selloff
In the Liberation Day fiasco, QLV didn’t protect as well as the other min vol ETFs, but it did significantly better than the S&P 500 on the way down. It also recovered better than the other min vol ETFs, though not as well as the S&P as the TACO trade came into full effect.
If you don’t know what the TACO trade is, it’s the funniest thing to happen in 2025. It refers to how Trump makes big, bold threats and then reverses his position. I’m not sure it’s actually him chickening out every time — it might be part of a negotiating strategy — but I don’t want 1,000 angry political comments, so let’s move on to my next two winners.
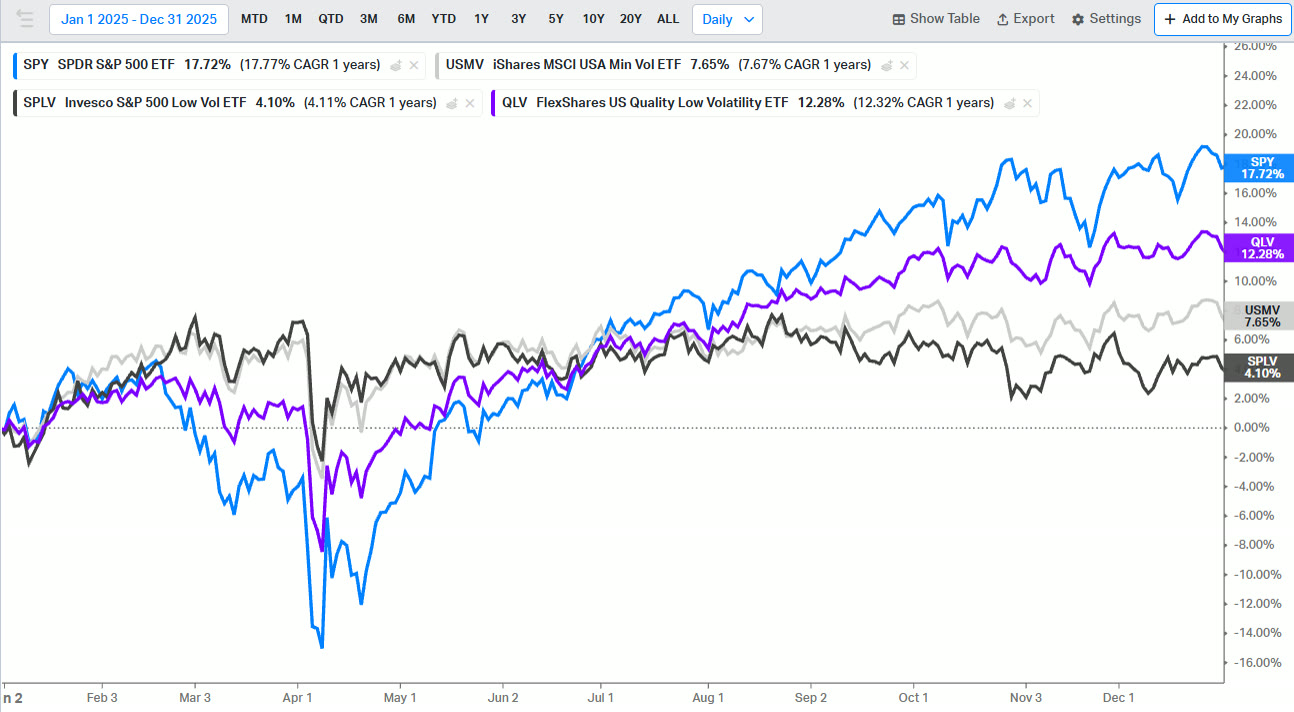
Liberation Day 2025: all three beat the S&P on the way down, and none kept up with it on the way up.
Two Active Alternatives to Low Volatility ETFs
These two aren’t low volatility factor ETFs, meaning they don’t simply screen for companies that were less volatile in the past. They’re active ETFs that take different routes to lower volatility, and both are compelling alternatives in my opinion.
TDVG: T. Rowe Price Dividend Growth ETF
TDVG takes a bottom-up approach, meaning portfolio managers build the fund company by company. It focuses on undervalued companies (think value factor) with sustainable, above-average growth in earnings and dividends (think quality factor).
These are all characteristics of companies that tend to hold up well in down markets. Stable earnings growth, strong competitive advantages and durable business models are the hallmarks of quality, and in a recession, when lots of companies are losing money, the ones that can still grow consistently tend to command a premium.
Dividend growth also tends to bring stability in downturns. A company’s dividend comes out of its earnings. If it’s not only still paying a dividend but actually raising it, that’s a very strong sign of management’s confidence in the business. When lots of businesses are deteriorating and everyone is freaking out, the ones that can inspire confidence by continuing to raise their dividends tend to command a premium.
So high-quality, stable dividend growers should be a solid recipe for lower volatility. Maybe not as low as a typical low volatility ETF, but likely lower volatility and better downside protection than the broader market, with possibly more upside than the typical low volatility ETF.
CGBL: Capital Group Core Balanced ETF
For someone who wants more downside protection, I think CGBL is worth considering. It’s only 50–75% stocks, so of course it’s likely to protect on the downside most of the time and make less on the upside. But I think it’s likely to be better than an even trade, and I’ll show you why.
Its stocks are quality companies, diversified between growth-oriented and dividend-paying names, and its bond portion is there to diversify away from stocks: lower volatility and smaller losses in an equity downturn.
Why I’m Showing the Mutual Funds Instead
TDVG has only been around since 2020 and CGBL since 2023, so I’m going to show you similar funds with much longer histories. With active managers, I generally wouldn’t trust any fund without a long enough track record to see how it behaves in different environments, and more importantly, whether its investment process is likely to keep working. It’s never a guarantee, but I feel a lot better about a fund that’s done it consistently for 30+ years than one launched three years ago, because most active funds don’t consistently beat their benchmark over time.
TDVG is simply the ETF version of T. Rowe Price’s Dividend Growth mutual fund (PRDGX), which has been around since 1992. Since the ETF launched, returns have been practically identical.
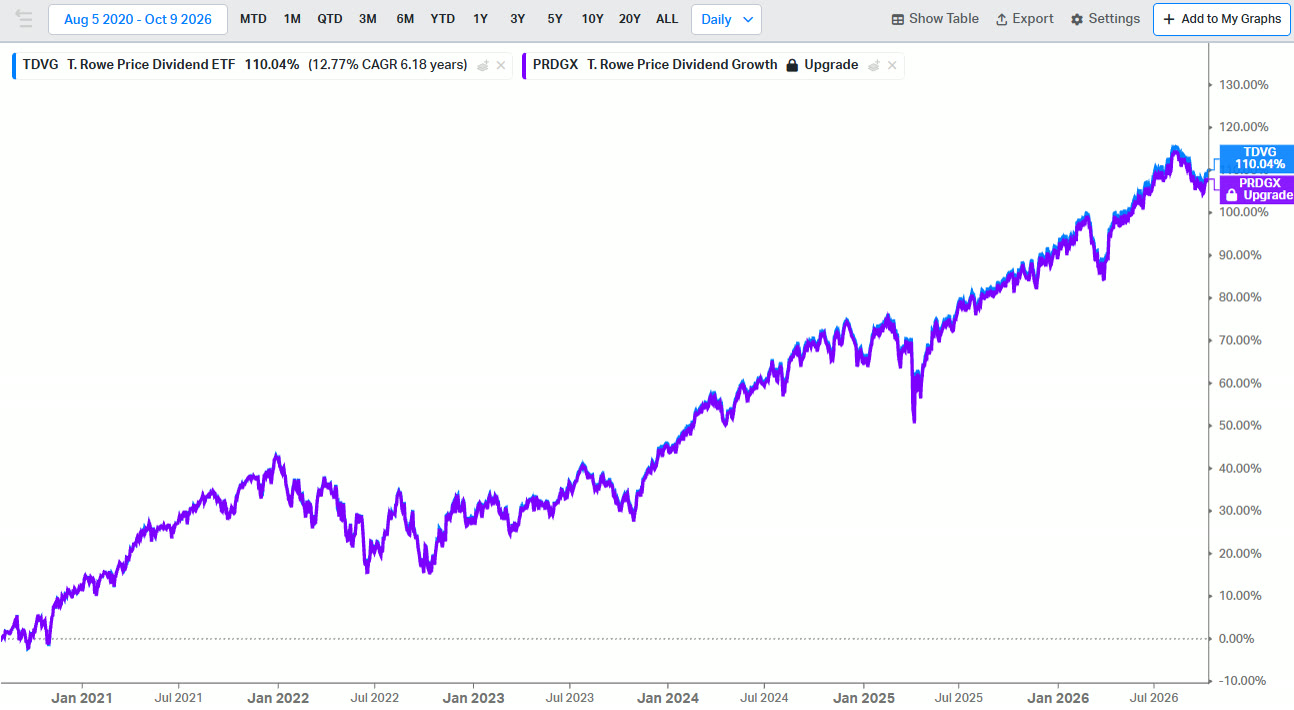
TDVG and its mutual fund twin, PRDGX, since the ETF’s launch.
CGBL isn’t technically the same as American Balanced Fund (ABALX), which has been around since 1975, but the two are close enough that I’m comfortable using it for this illustration. You can always invest in American Balanced directly if you don’t think it’s close enough. Both target 50–75% stocks, both use mostly high-quality bonds as ballast in an equity downturn, and both are managed with the same investment process. Three of CGBL’s five portfolio managers are also on the 11-person American Balanced team.
They do have a few slight differences, like up to 20% non-U.S. exposure for American Balanced versus 15% for CGBL. But past results aren’t a perfect predictor of the future even for the exact same fund, so given the shared process, objectives, allocations and even managers, American Balanced is a good way to show Capital Group’s ability to run a portfolio like this through many market environments. And if you want an ETF for tax efficiency, CGBL is the closest thing to an ETF version of it. Since CGBL launched, results have been pretty close, though not as close as TDVG and PRDGX.
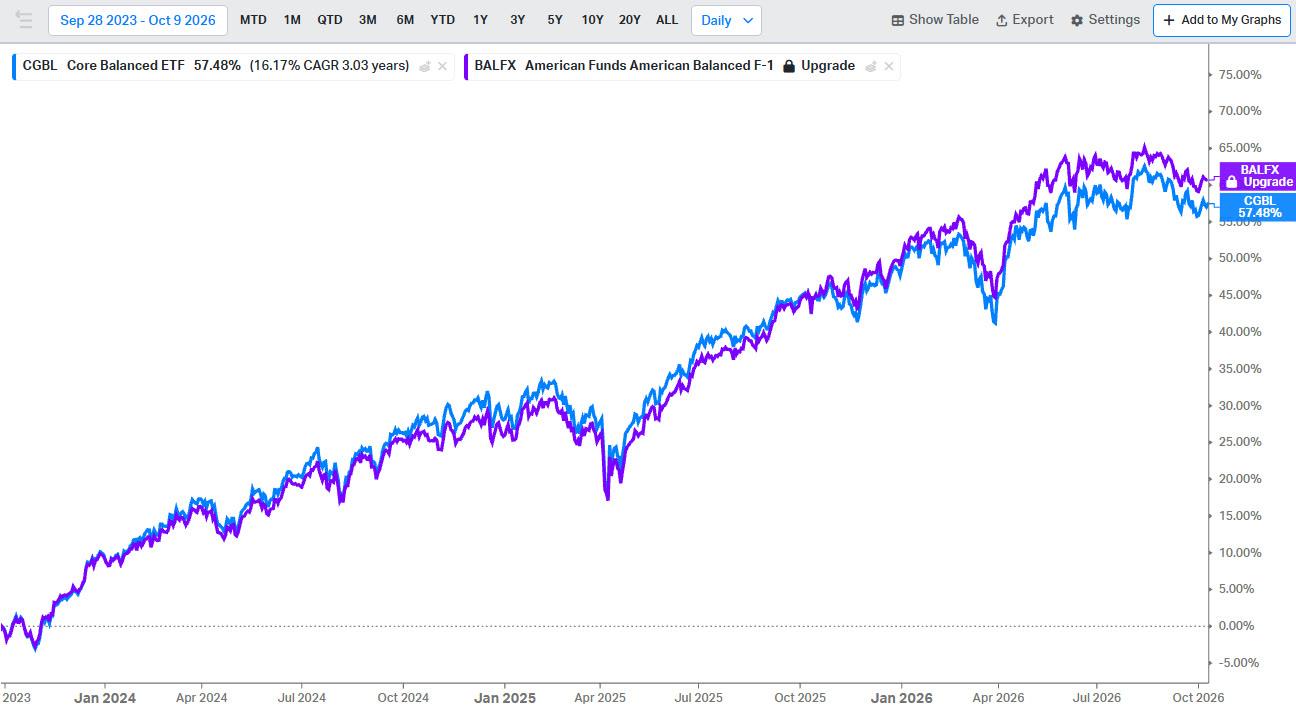
CGBL and American Balanced Fund since CGBL’s launch.
All Five Funds Through Every Downturn Since 2008
Now let’s compare T. Rowe Price Dividend Growth and American Balanced with the other funds. I’ll work backwards, since some funds drop off as we go past their launch dates.
Liberation Day 2025
Everything beat the S&P on the way down, and nothing beat it on the way up. No surprise there. Of the lower volatility options, American Balanced lost less than my other two picks on the downside, but more than the other min vol ETFs. All three of my picks recovered more strongly, though: T. Rowe beat QLV, and American Balanced beat everything. It won by losing less. In a long, sustained equity rally it’s almost certain to fall behind, but in a rocky environment like this, that’s exactly what these kinds of investments are supposed to do.
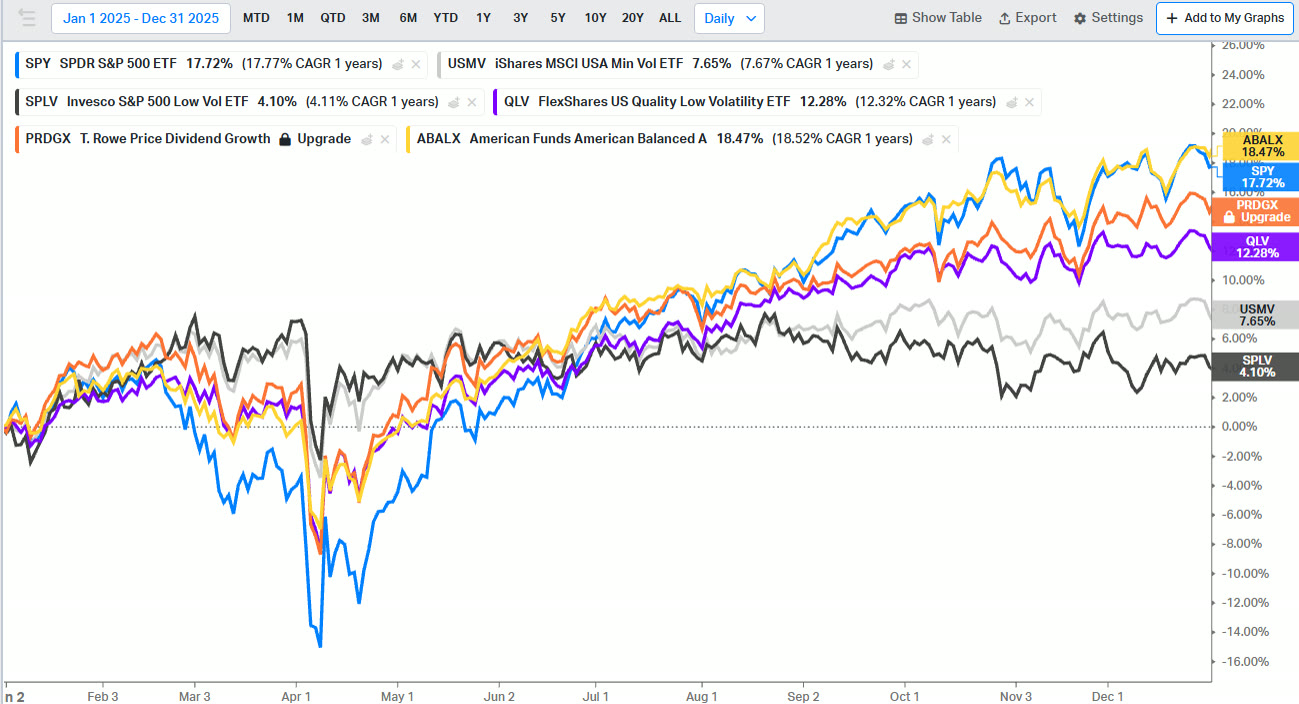
Liberation Day 2025: everything beat the S&P on the way down, and nothing beat it on the way up.
2022
Everything beat the S&P once again. QLV held up best after SPLV, which is the extreme version of a low volatility fund. I’d usually expect American Balanced to lose less than all of these, but this is the one key exception: if a downturn is caused by rapidly rising interest rates, bonds lose money too. Bonds still lost less than stocks, but that’s not as good as almost every other downturn, when conservative bonds are making money while stocks fall.
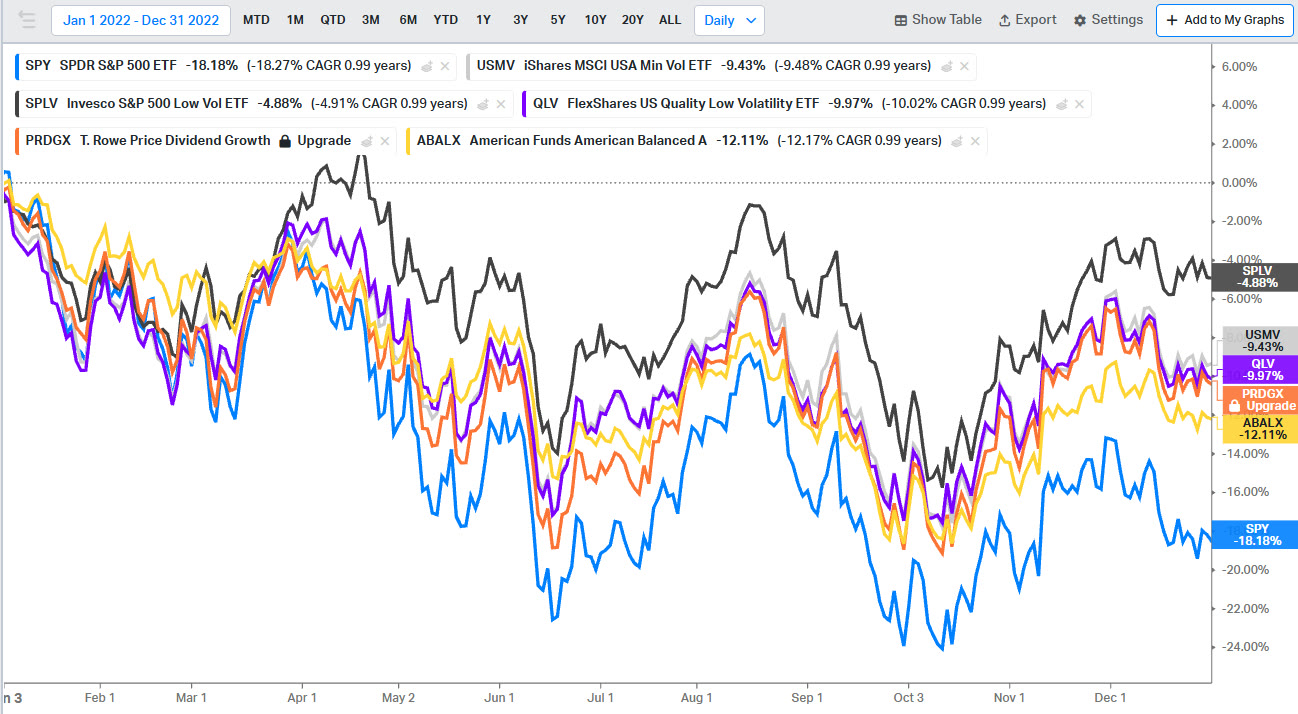
2022: every option beat the S&P 500, and SPLV held up best.
2020
The other low volatility approaches didn’t really work. Even conservative businesses were losing business because they were forced to shut down, or investors dumped them because the government made them stop paying the dividends that were the main reason to own them. But you know what did great? Bonds. Interest rates fell to zero, boosting bonds, and they did their job, unlike in 2022. American Balanced lost far less than the other funds. It also recovered less, because it’s not 100% stocks, but that return pattern might appeal to a lot of investors. In the recovery, SPY did best, of course, followed by T. Rowe, then QLV, then the traditional low volatility ETFs.
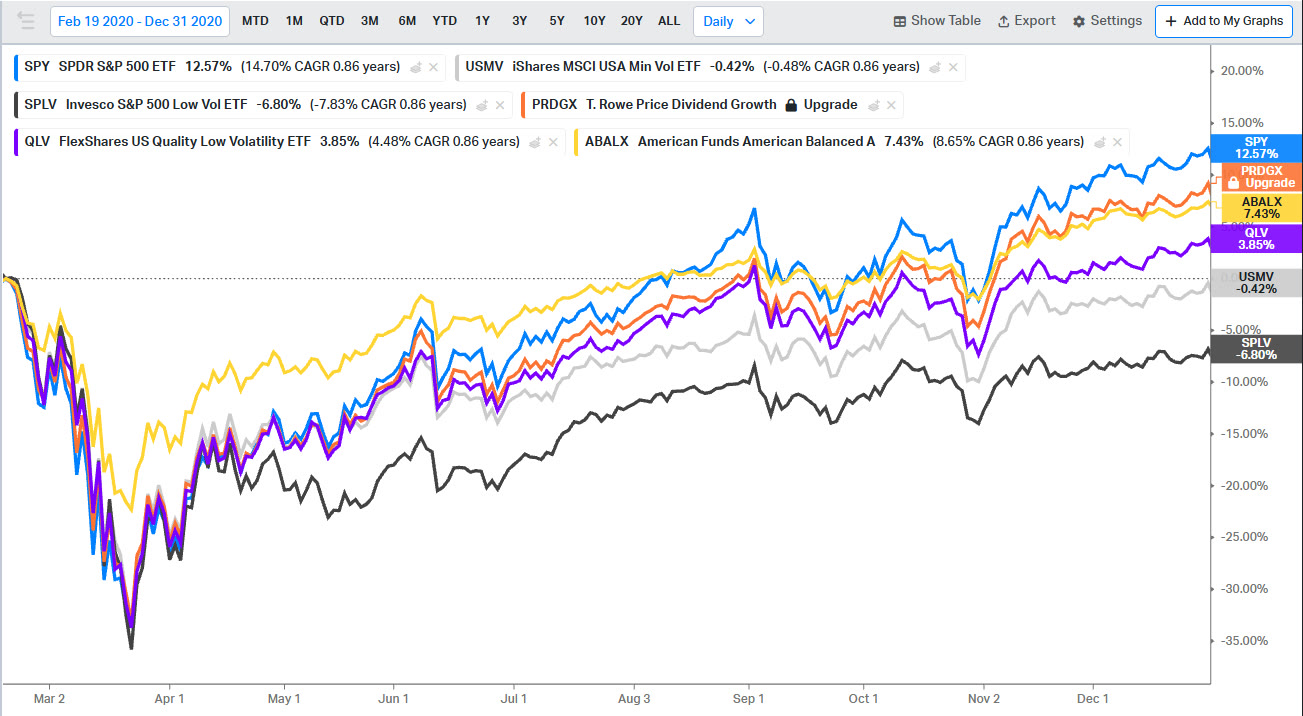
2020: bonds did their job, so American Balanced (yellow) lost far less than everything else.
2018
QLV wasn’t around for the start of the 2018 downturn, but we can look at the full period for the others. American Balanced lost the least, and SPLV — I’m going to call it “super low vol” from now on — lost the second least. To no one’s surprise, the S&P lost the most. The recovery is harder to judge since each started from a different low, but American Balanced clearly had the weakest recovery: it lost the least on the way down and still finished at the bottom. The low vol ETFs kept their leads through the end of 2019, just two and a half months before the COVID crash. Most investors are quick to forget that the market doesn’t always go up.
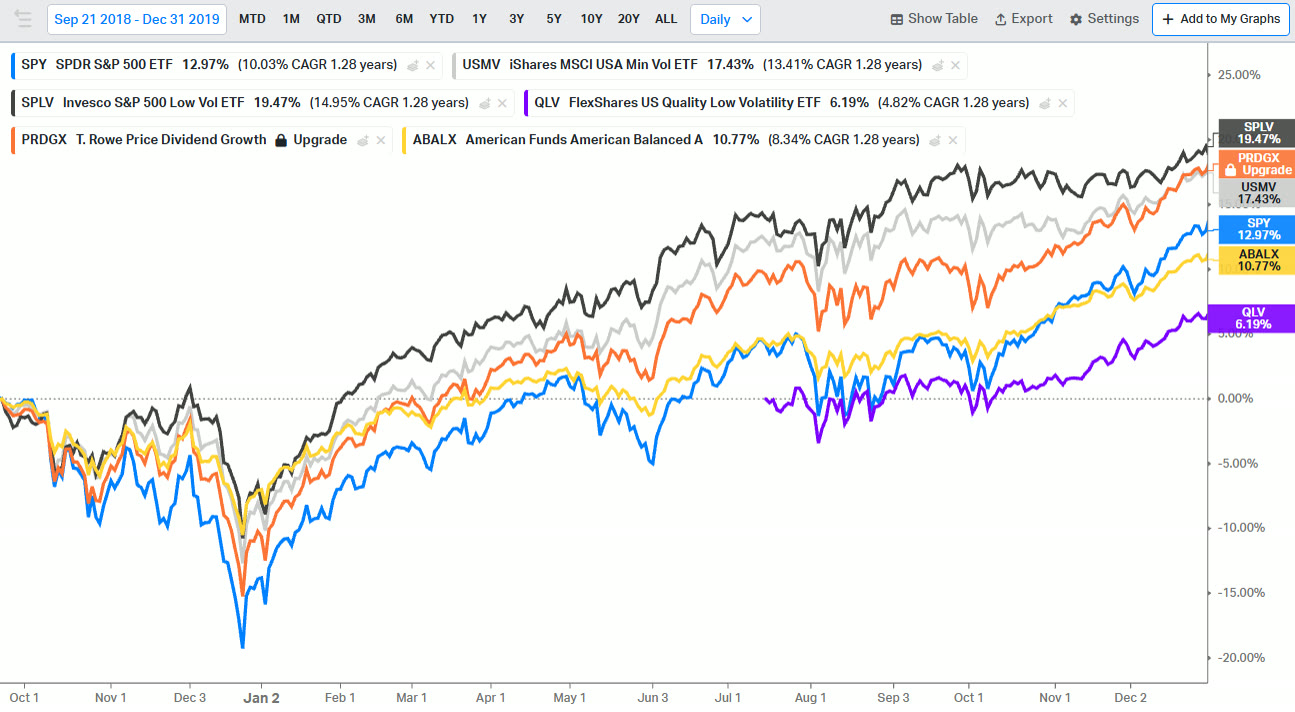
2018–2019: American Balanced lost the least, SPLV (“super low vol”) second.
2015–2016
American Balanced once again lost the least, followed closely by super low vol, with the S&P falling the most. In the second leg of that downturn, in early 2016 (remember the “worst start to a year of all time” headlines?), the pure low vol ETFs held up best at the February bottom, then gave up most of that lead by year end. American Balanced had the weakest recovery, while T. Rowe kept decent pace with the S&P and finished slightly ahead.
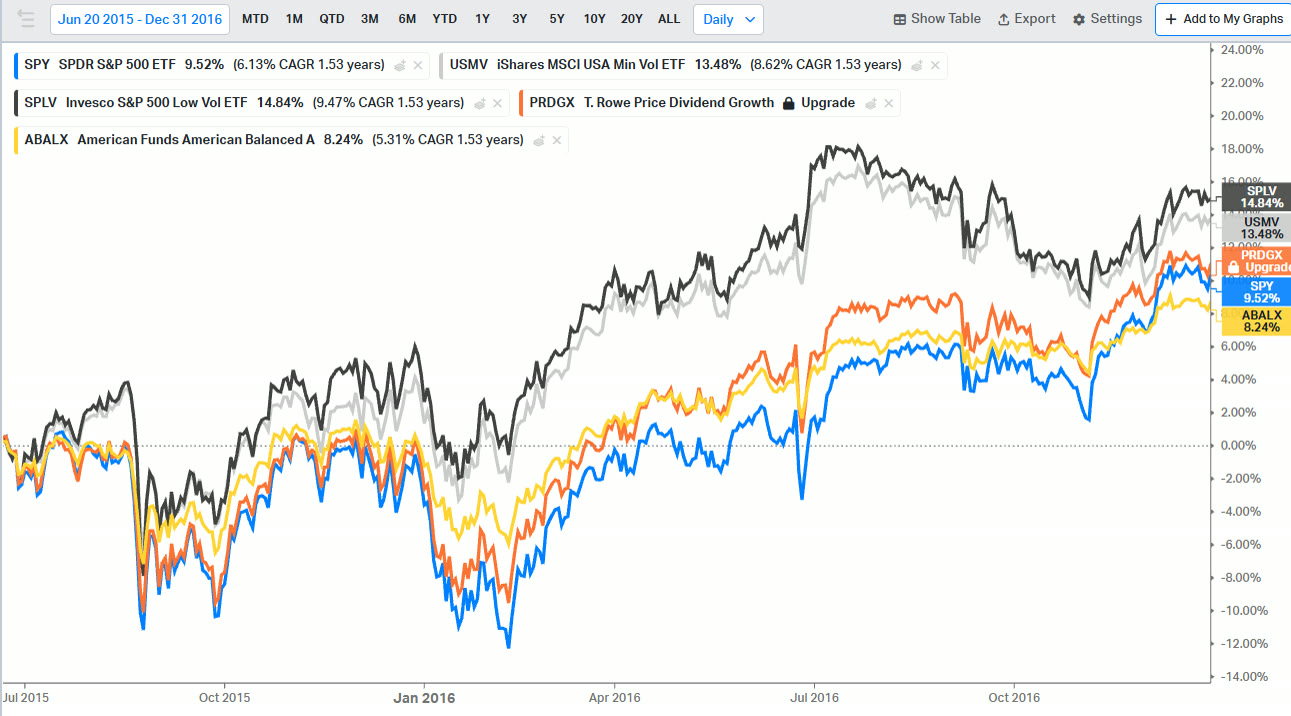
2015–2016: the pure low vol ETFs led at the bottom, then gave most of it back.
2011
USMV drops off here. American Balanced once again lost the least, followed by SPLV. T. Rowe fell a bit less than the S&P, as usual, then fell slightly behind it in the recovery. All pretty typical.
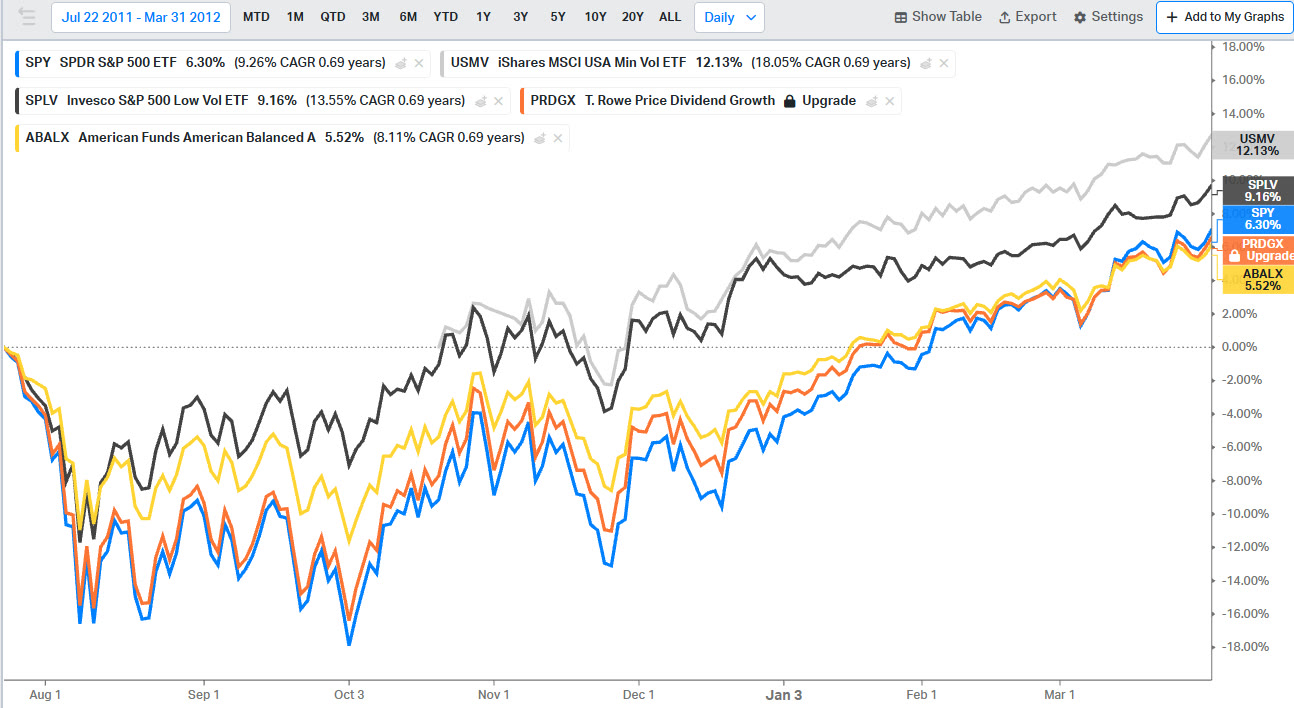
2011: American Balanced lost the least again.
2008
And then there’s the big one. In 2008, American Balanced lost significantly less than the others, and T. Rowe did quite a bit better than the S&P.
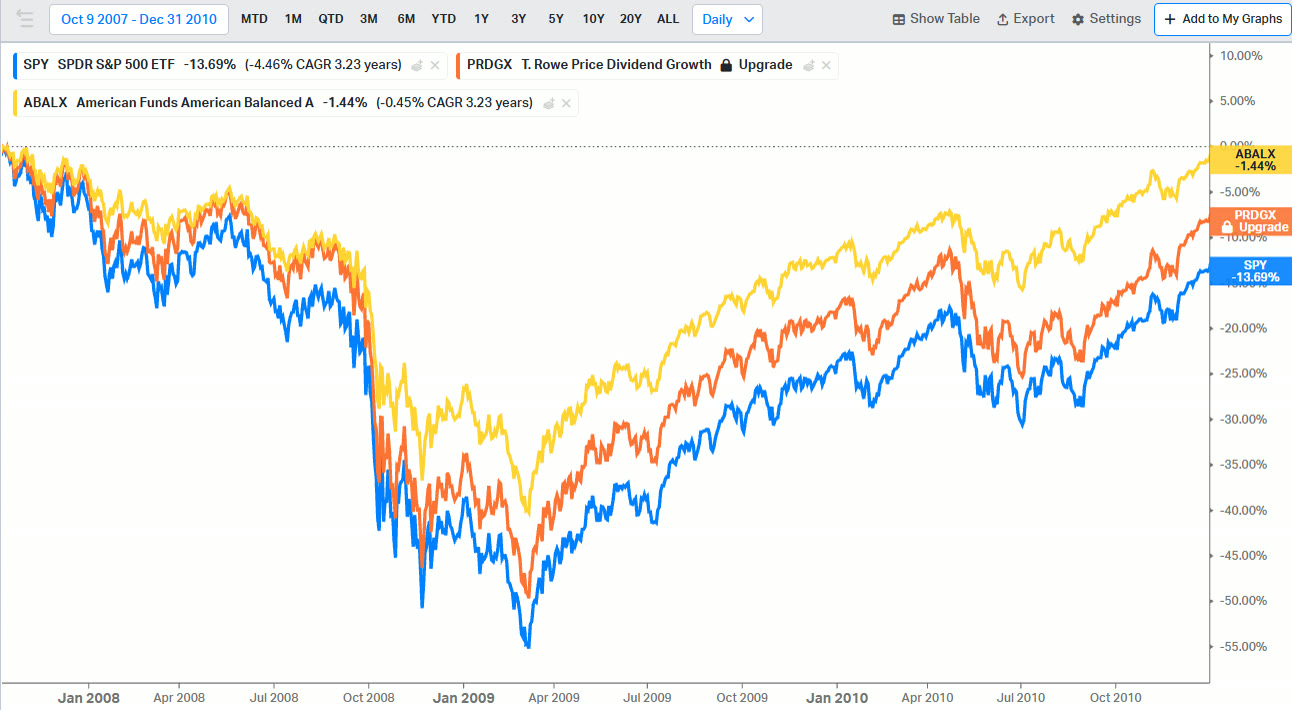
2008: American Balanced (yellow) lost far less than the S&P 500 (blue).
Long-Term Returns: The Upside Matters Too
You can’t focus only on downturns unless you have a crystal ball and know when they’re coming, in which case I’d suggest you buy none of these and come work for Fundamentals of Finance instead.
In the long run, the S&P has won. This has been an abnormally good period for U.S. stocks, so I’d expect the others to be closer in most 15-ish-year periods, but I’d still expect the S&P to offer the highest long-term upside in most scenarios.
Here’s why I prefer American Balanced (or CGBL) over SPLV, though. Remember how American Balanced lost less than SPLV in almost every downturn? Over the nearly 15 years since SPLV launched, American Balanced has also produced higher returns. That shows how incredibly well this fund has done over time, and not just since 2011, but since it launched in 1975.
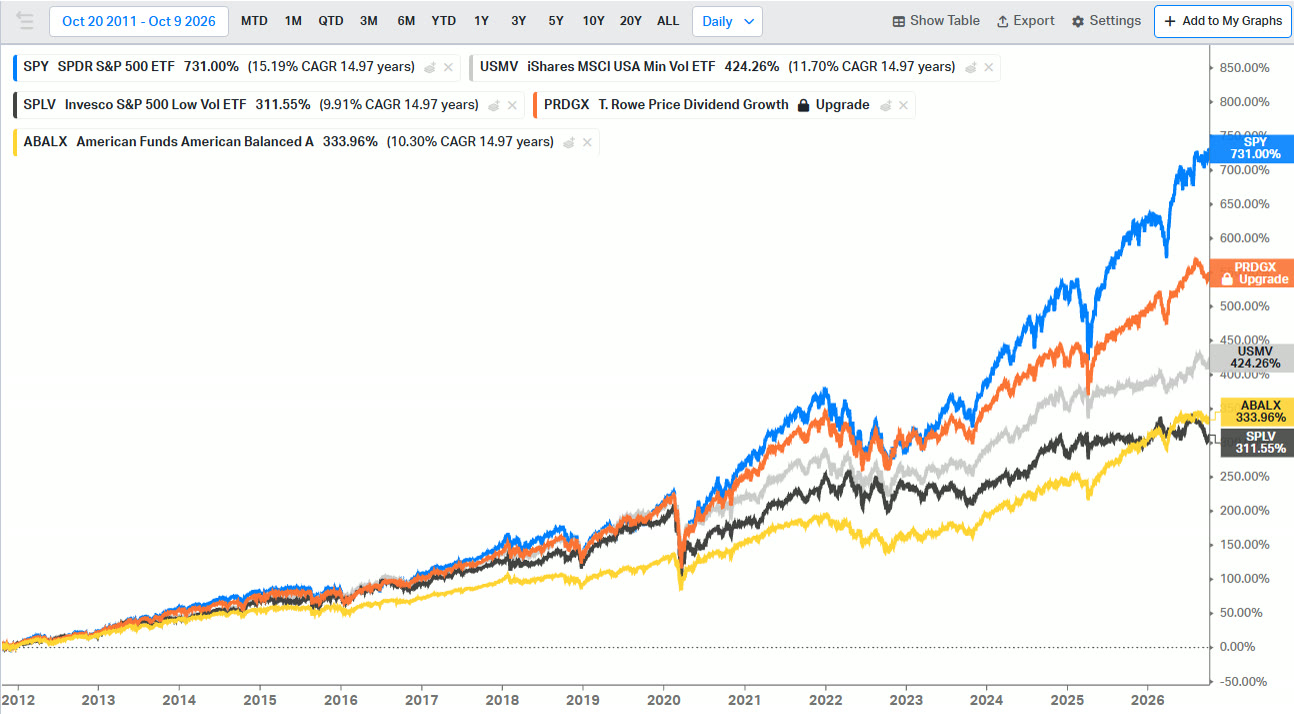
Since SPLV’s launch in 2011, American Balanced has beaten it on total return as well as on downside protection.
Extend it back to T. Rowe’s 1992 launch and you can see how well that one has done, too. It fell behind SPY in the tech bubble, took the lead in the crash, and stayed ahead almost the entire time until what is, in my opinion, the next tech bubble. Even on total return, it wouldn’t surprise me at all if T. Rowe Price Dividend Growth beat the S&P over the next 10 years, given where valuations are, the hype around AI, and how dividends have been left behind for most of the last 15 years. I like this one a lot, even though my main objective is not downside protection.
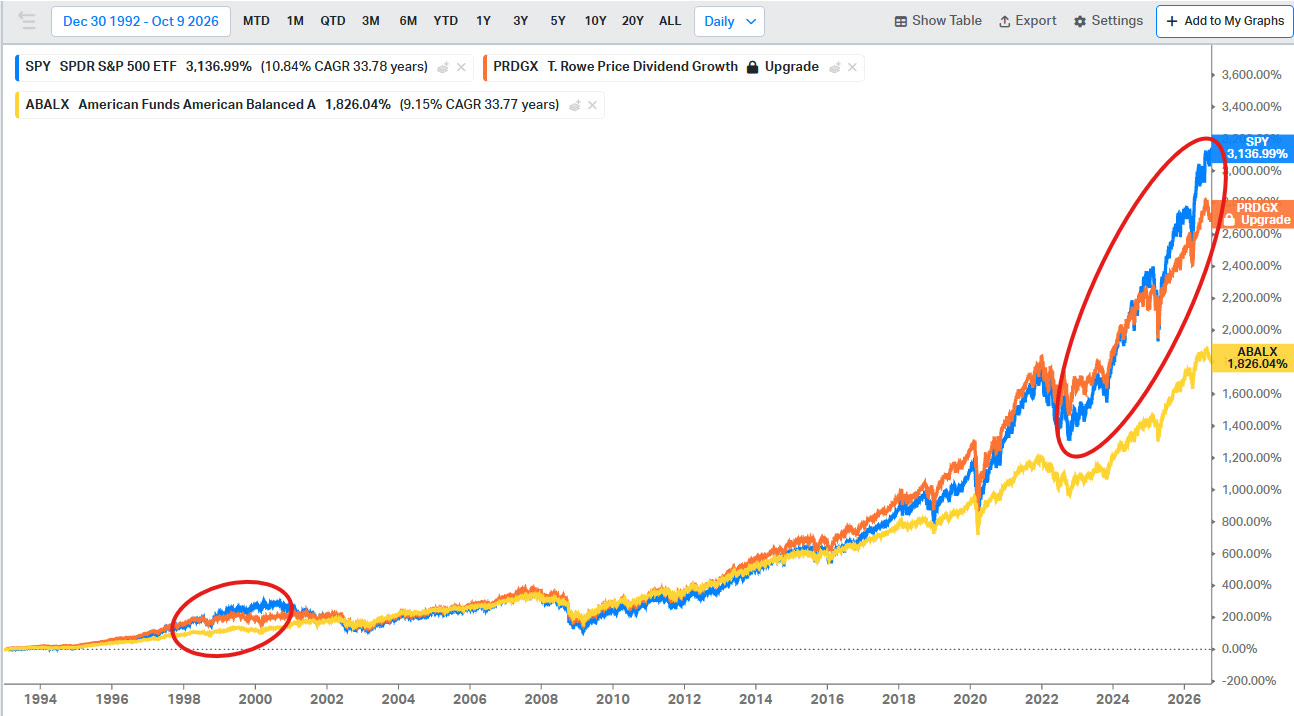
Since 1992: T. Rowe Price Dividend Growth trailed the S&P only in the two tech-driven rallies (circled).
Risk-Adjusted Returns: The Sharpe Ratio
In the end, factor investing is supposed to improve risk-adjusted returns: either by reducing risk more than you reduce return, as with minimum volatility, or by increasing return more than you increase risk, as with small caps or momentum. To measure that, I use the Sharpe ratio, which is return per unit of risk:
Sharpe ratio = (portfolio return − risk-free rate) ÷ standard deviation
The risk-free rate is usually the 3-month Treasury bill, the return you’d get by parking your money and taking no risk. So the top of the formula is how much extra return you earned by taking risk, and the bottom is how much risk you took. A lot of return with low risk gives a high Sharpe ratio, and that’s what you want.
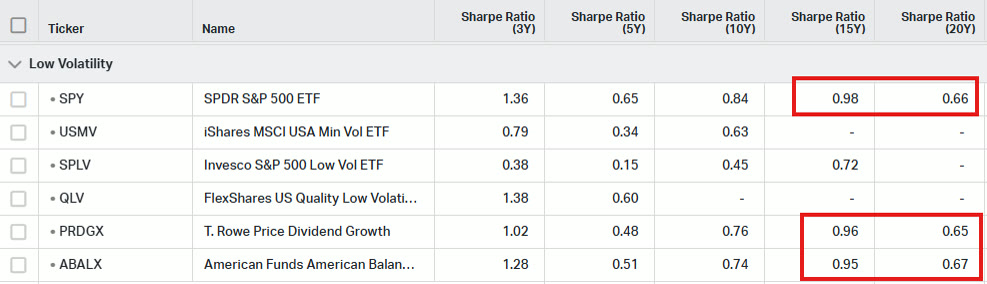
Over 15 and 20 years, T. Rowe Price Dividend Growth and American Balanced are essentially tied with the S&P 500.
Over the last 15 and 20 years, T. Rowe and American Balanced have been essentially tied with the S&P. So did they improve it? Not by much. But context is key: this has been an exceptionally good period for U.S. large-cap stocks, and it won’t always be that way. The rolling 3-year Sharpe ratios show it.
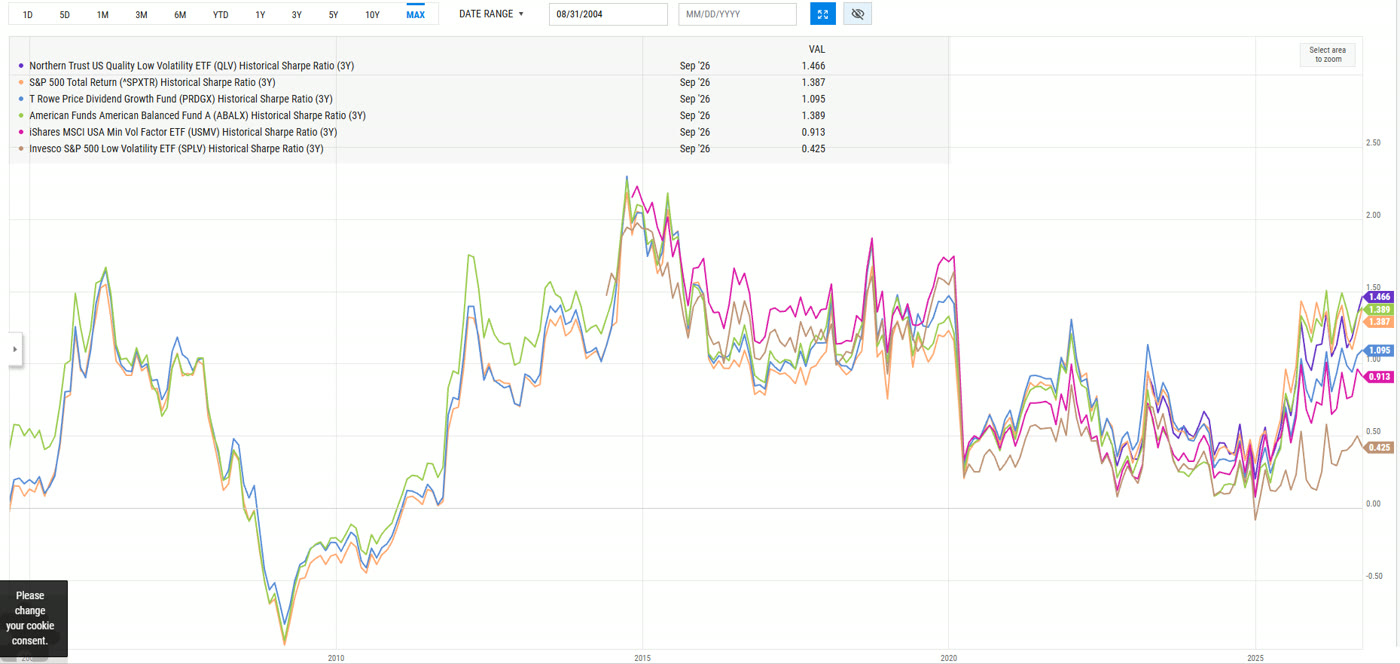
Rolling 3-year Sharpe ratios. Colors differ from the earlier charts: American Balanced is green, T. Rowe blue, the S&P 500 orange, USMV magenta and SPLV brown.
Starting around 2002–2005, at the tail end of the tech bust, American Balanced led T. Rowe and the S&P 500. T. Rowe took the lead for a few years in the mid-2000s, then American Balanced took it back after the 2008 crash until around 2015. All the while, the S&P was in last place. Once USMV built a 3-year track record it took the lead, with super low vol second, and the S&P stayed last all the way through the 2020 crash. For nearly 20 years, the S&P had a consistently lower Sharpe ratio than every one of these funds.
Since 2020 it’s been more mixed: T. Rowe and American Balanced led for most of 2020–2025, with the S&P in the middle of the pack, until 2025, when the S&P finally pulled near the top. It’s currently back behind QLV and American Balanced again.
So these funds have pretty consistently improved risk-adjusted returns over the S&P, but nothing is guaranteed and nothing works all the time. If you told me we were about to have a massive equity rally led by a small handful of the largest U.S. companies, I’d tell you to be heavily concentrated in the largest U.S. companies — the S&P 500. But we’ve already had that environment, which makes it less likely to repeat from here, so I wouldn’t bank on it.
How the Three Funds Compare
QLV (Northern Trust US Quality Low Volatility ETF): a factor approach, quality plus low volatility with sector guardrails. Expense ratio 0.08%. Fits an investor who wants a pure, low-cost factor approach.
TDVG (T. Rowe Price Dividend Growth ETF): actively managed, undervalued high-quality dividend growers. Expense ratio 0.50%. Fits an investor who wants some downside protection while still participating in the upside, or a tilt away from the AI trade.
CGBL (Capital Group Core Balanced ETF): actively managed, 50–75% quality stocks with the rest in high-quality bonds. Expense ratio 0.33%. Fits an investor who wants more potential downside protection and a proven 50-year process in a similar strategy, accepting less upside.
For a pure factor-based approach, QLV’s combination of quality and low volatility at an unbelievably low 8 basis points makes it an attractive option. For a longer, more proven track record and potentially even better downside protection, at the cost of probably less upside, American Balanced or the similar CGBL is a solid option. And for someone who wants some downside protection but still wants to participate more on the upside — or who wants U.S. stocks with a slight tilt away from the AI trade — T. Rowe Price Dividend Growth, as the mutual fund or the ETF, could be worth a deeper look.
That’s it for our series on factor investing. If you’ve followed all 11 parts, we really appreciate it.
Watch the Full Video
Want to Go Deeper? In the Fundamentals of Finance Academy, Ethan breaks down funds and current market events on a live call every other week, and members get the full archive of recorded calls. Learn more about the Academy →

This article is for educational purposes only and is not investment advice. Ethan is a CFA charterholder, but nothing here is a recommendation to buy or sell any security, and it does not take your personal situation into account. Past performance does not guarantee future results. Charts of index returns are for illustration only and don’t reflect the fees, expenses or taxes of any actual investment. Performance data and expense ratios are as of 10/14/2026 and will change; check each fund’s website for current figures. Charts show historical returns of the funds named; mutual funds are shown in place of newer ETFs where noted.
