Asset Allocation: The Ultimate Guide to Build Your Perfect Portfolio at Any Age
About this article: This article is based on Ethan’s video, originally published on May 17, 2024. Because the written version was published later, returns, yields and fund details reflect data available at the time of the video and have likely changed since. Please check each fund’s website for current figures.
You know you shouldn’t put all your eggs in one basket. But how do you decide which baskets, and how many eggs go in each? Usually you get one of two answers: a one-size-fits-all portfolio from a YouTuber, or a professional who’ll work it out for a fee. I used to help financial advisors build portfolios for their clients, so in this guide I’ll walk you through how professionals think about it, and the free tools you can use to do the same analysis yourself.
The Short Version
An asset allocation has to pass two tests: it should be expected to reach your goals, and you have to be able to stick with it through bad markets.
Stocks are for long-term growth, international stocks for diversification, and bonds for downside protection and income.
Rolling returns show the realistic best and worst cases of a mix, which helps you judge whether you’d hold on in a downturn.
“Mental accounting”, setting aside separate buckets for separate goals, can help real people stay invested.
A Baseline: What the Target Date Funds Do
To set a starting point, I averaged the allocations of the seven target date retirement series rated Gold by Morningstar as of March 31, 2024. A target date series is a set of funds that gets more conservative as you approach retirement. Here’s that average by age, and by years until retirement (negative numbers mean you’re already retired).
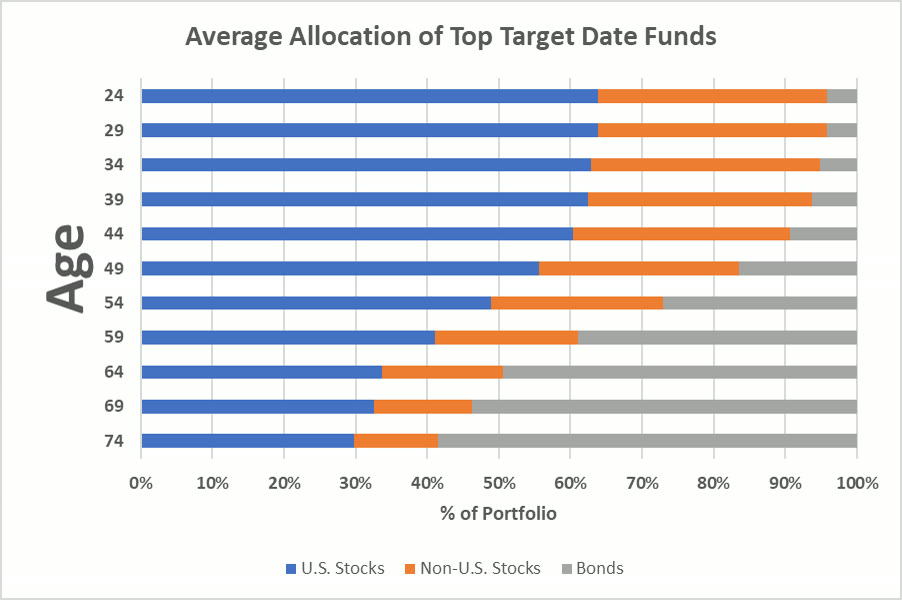
Average allocation of the top-rated target date series, by age.
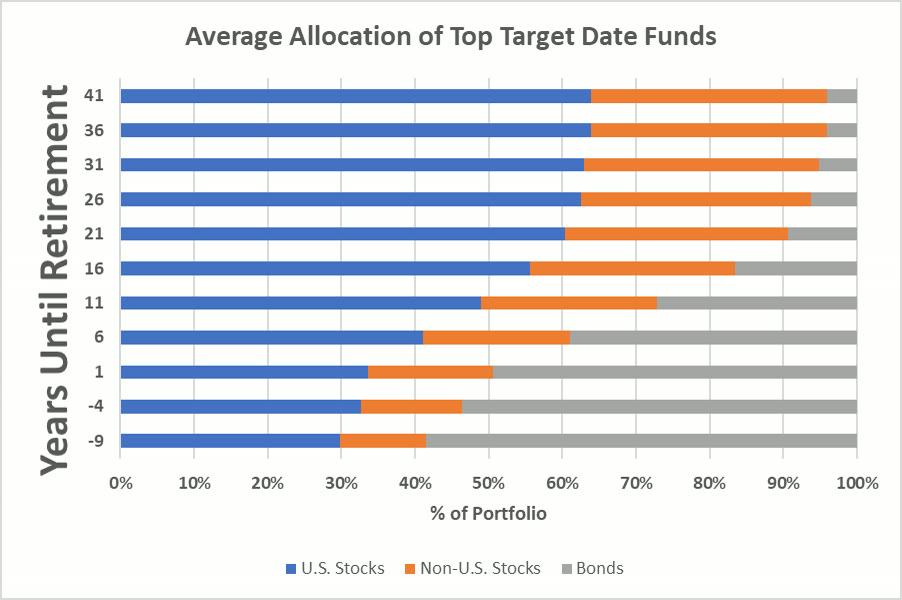
The same allocations by years until retirement. Negative numbers are years into retirement.
Think of these as what the experts suggest for the average person at each stage. But are you average? Maybe you have several goals, like retiring and buying a house. Maybe you started saving late, want to maximize long-term returns, or just aren’t comfortable with investing. All of those are real reasons to depart from the average, and the rest of this guide shows how to think them through.
The Two Tests Every Allocation Has to Pass
Building an allocation has two parts.
1. The math. Years until retirement, expected returns on each asset class, how much you’re saving. We’ll spend plenty of time on this, but people aren’t computers.
2. The emotions. Investors who are very uncomfortable with risk often choose to take less of it, even when the math says they could take more. Every model is built on long-term average returns, and a 10% average doesn’t mean 10% every year. In fact, the last time the S&P 500 returned anything close to 10% was 2016, and that year started with one of the worst openings in stock market history.

S&P 500 calendar-year returns, 2014 to early 2024: almost never close to the “average.”
This matters because fear and greed drive a lot of investment decisions, and selling when your investments are down is the number one mistake investors make. A plan that works in theory won’t work in reality if you abandon it. Dalbar measures the cost every year: from 2001 to 2020, the S&P 500 returned 7.5% a year and the main bond index 4.8%, but the average investor earned just 2.9%, largely because of bad timing.
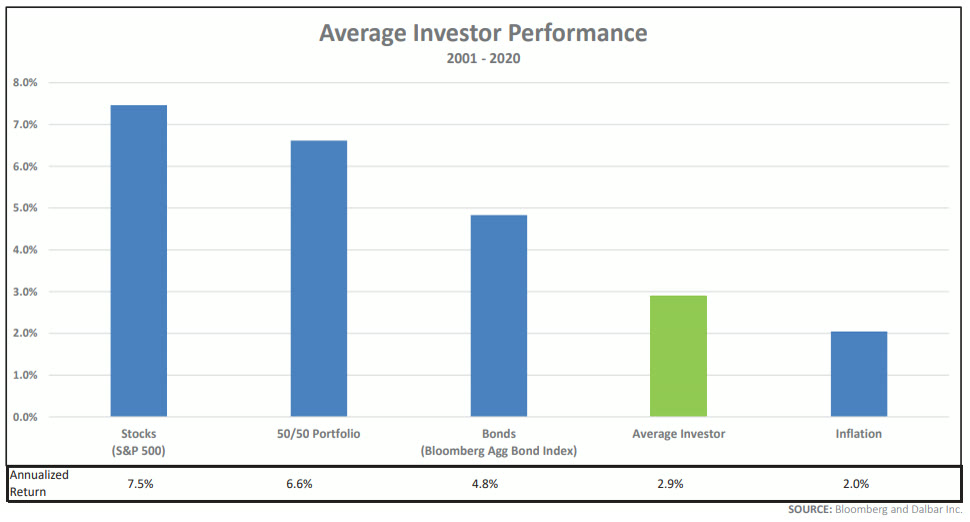
2001–2020: the average investor earned far less than the funds they invested in. Source: Dalbar.
A useful exercise many investors try: if my portfolio fell 10% in a month, what would I do? What about 30% in a year? The headlines will all be negative and it will seem like the world is ending, because it always feels worst at the bottom. An investor who expects they would sell in that moment is likely holding more risk than they can live with.
The goal is a portfolio that passes both tests: it’s expected to work if you stick with it, and you can realistically stick with it in good times and bad.
What Each Asset Class Is For
Most portfolios are built from three main pieces:
U.S. stocks: long-term growth. Their upside is much higher than bonds’.
International stocks: diversification. Sometimes the U.S. leads and sometimes the rest of the world does, so owning both can smooth returns without giving up long-term expected gains.
Bonds: downside protection, and sometimes income.
Then there are more specialized areas:
Emerging markets (companies in countries like China, India and Brazil) and small caps (much smaller than Apple or Microsoft, though not your local barber shop) are higher risk, higher potential reward. Many broad funds hold some of each, and dedicated funds let you dial the exposure up.
Bitcoin is a pure, ultra-high risk and reward option that can make sense as a small slice.
Gold is something I’m unlikely ever to own. Its long-term return potential is well below stocks, and it hedges a stock portfolio less well than bonds do. People cite low correlation, inflation protection or a weak dollar, but you can poke big holes in each of those arguments.
Real estate can be an amazing investment, but I prefer owning it directly, because its real wealth-building tool is leverage. Put $100,000 down on a $500,000 house, and if it rises 10% to $550,000, you’ve made 50% on your money, with mortgage interest that may be tax-deductible. A REIT doesn’t give you that.
Commodities can be a speculative play, but most broad stock funds already hold energy and mining companies, so I don’t think a separate commodity fund adds much.
Step 1: The Stock and Bond Mix
To compare how different mixes have behaved, I use the free backtest tool at portfoliovisualizer.com (they don’t sponsor us). You enter funds on the left and each portfolio’s weights on the right, set it to monthly data for accuracy, and click “Analyze Portfolios.”
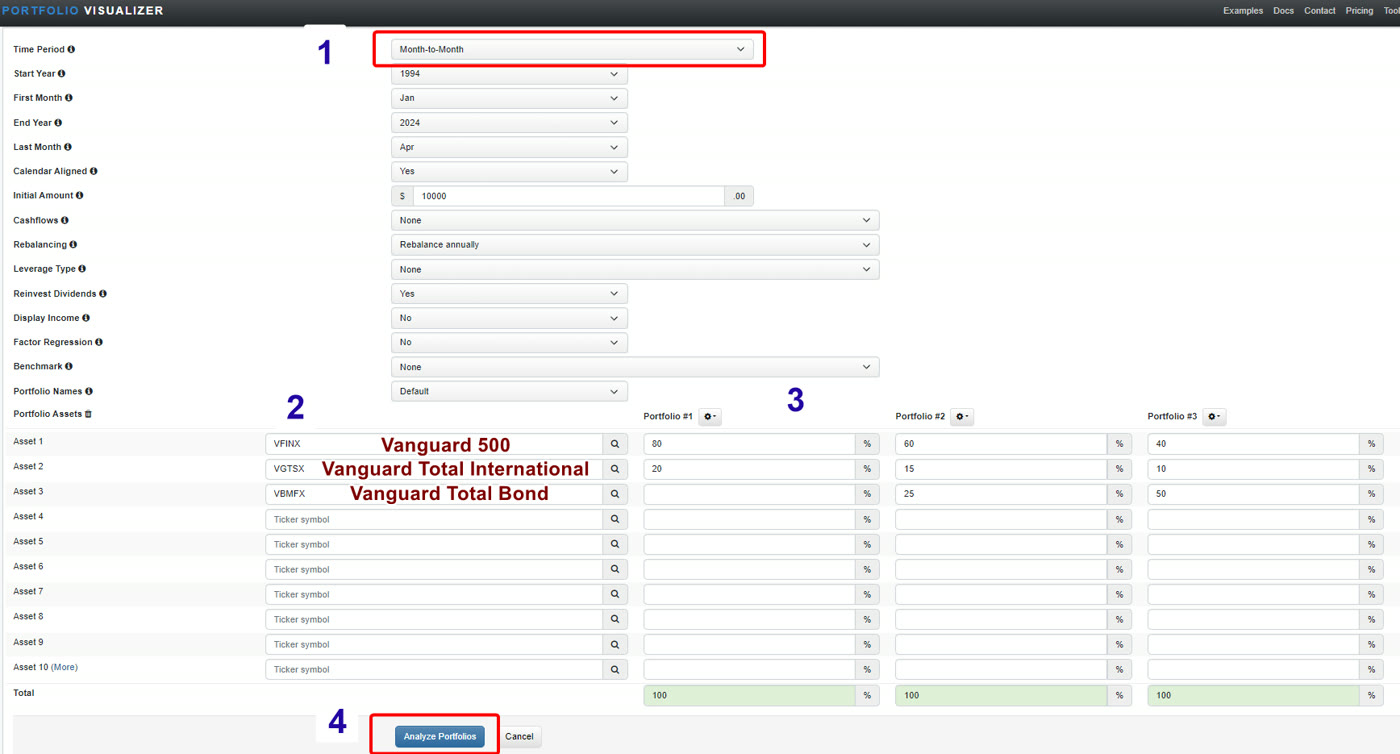
Setting up the backtest with the oldest Vanguard U.S., international and total bond index funds.
I used the oldest U.S., international and bond index funds to go back as far as possible. Every portfolio splits its stocks 80% U.S. and 20% international; only the bond share changes:
Portfolio 1: 100% stocks
Portfolio 2: 75% stocks, 25% bonds
Portfolio 3: 50% stocks, 50% bonds
Rolling Returns: The Most Underrated Tool in Investing
So many people look at the last couple of years and assume that’s what comes next. It isn’t. Rolling returns show every period of a given length: every three-year stretch, for example, from March 2000 to March 2003, April 2000 to April 2003, and so on. That gives a much better picture of how a mix behaves in different environments, and whether you could realistically hold on in the worst case.
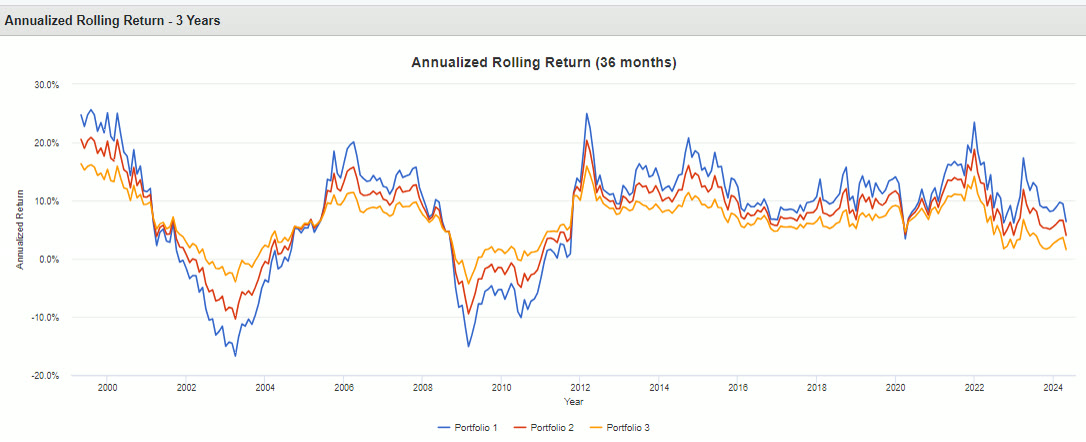
Rolling three-year returns: the 50/50 mix (yellow) lags all-stocks (blue) in up markets and holds up better in down markets.
The table above the chart is the most useful part. It shows the average, best and worst return over every 1-year, 3-year, 5-year period and beyond. Over any 15-year period since 1996, the worst result for the 100% stock portfolio was still a positive 3.65% a year. Not great, but still up.
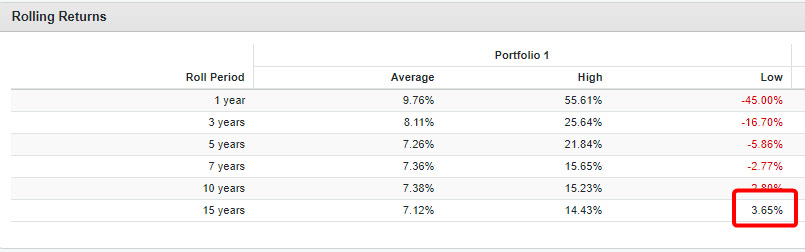
The all-stock portfolio’s worst 15-year return since 1996: +3.65% a year.
That’s why, if I personally had 15 or more years until retirement, I wouldn’t want to hold any bonds, as long as I was comfortable with the swings. Stocks are for upside and bonds are for reducing volatility, and even a small bond allocation through your 20s, 30s and 40s can noticeably hold back long-term results.
Now compare the worst cases. The all-stock portfolio’s worst one-year loss was about 45%. For the 75/25 mix it was about 34%. The question this answers is whether an investor could stay invested through a 45% drop. Those who could are better positioned to hold an all-stock mix; those who couldn’t often choose a lower-risk mix, even when young. The drawdowns tab shows how far each portfolio fell from peak to trough, which helps with multi-year downturns.
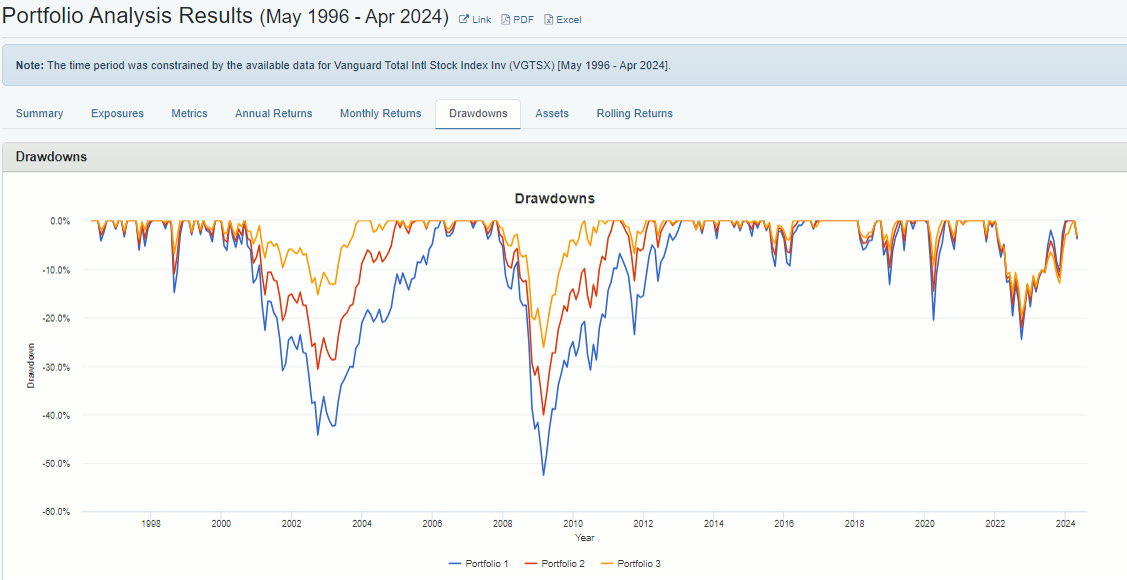
Peak-to-trough drawdowns for each mix.
One caveat: the future can be worse than the past. But going back this far and looking at this many periods gives a solid sense of the likely range of outcomes, and if you can’t stick to a plan, it probably won’t work the way you hoped.
Will the Mix Get You to Your Goal?
The same tool helps with the math. On the “Metrics” tab, the number to note is “geometric mean annualized,” your long-run average yearly return. Then plug it into a retirement calculator. I used Lincoln Financial’s free one (search “Lincoln retirement calculator”).
Example: you’re 35, earn $100,000 a year, are single (or your spouse doesn’t work), have $150,000 saved and want to retire at 65. A few inputs I’d change from the defaults:
Years of retirement income: I planned to at least age 100. The default is 20 years, and running out of money at 85 is a real risk.
Inflation: I used 2%, the Fed’s target. Before 2021 the Fed struggled for years to get inflation up to 2%.
Income replacement: I used 100%, not the default 75%. Once you’re used to a lifestyle, you may need more in retirement for travel, health care or golf.
Returns: 8.61% before retirement (the all-stock portfolio’s historical return) and, to be conservative, 6% after (the 50/50 mix returned 6.73%).
Social Security: included.
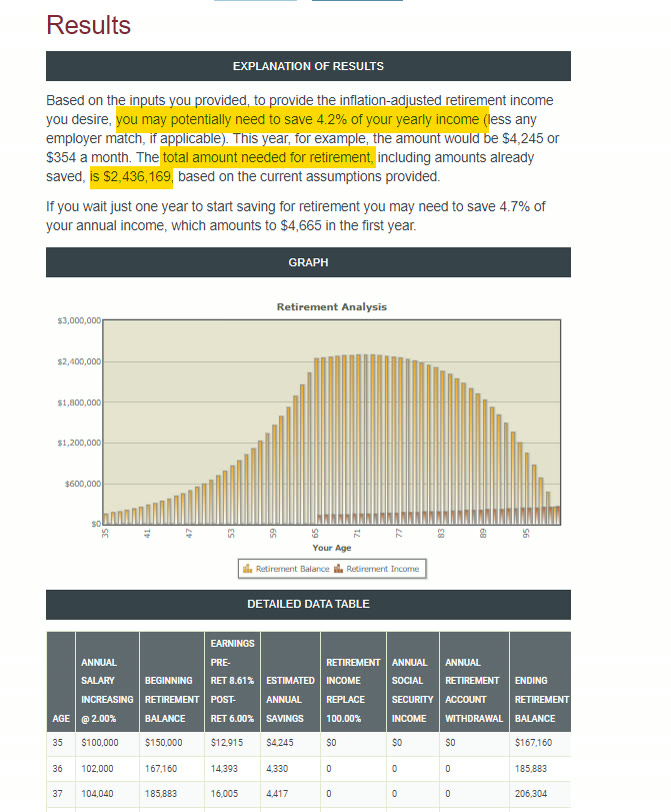
With these inputs, the calculator says saving 4.2% of income gets to about $2.4 million by 65.
That would last until age 100 in this example. Personally I’d save a lot more than that to leave room for error; the common rule of thumb is 15%. One more quirk: the calculator only uses inflation to grow your salary. For someone expecting promotions, pay may grow faster than inflation, which that input doesn’t capture.
Step 2: U.S. vs. International
The same backtest tool helps here. I compared 100% U.S., 50/50 U.S. and international, and 50% U.S. / 30% international / 20% emerging markets. Over the last 10 to 15 years, you can see why many people think investing abroad is pointless: the all-U.S. portfolio (blue) crushed the others.
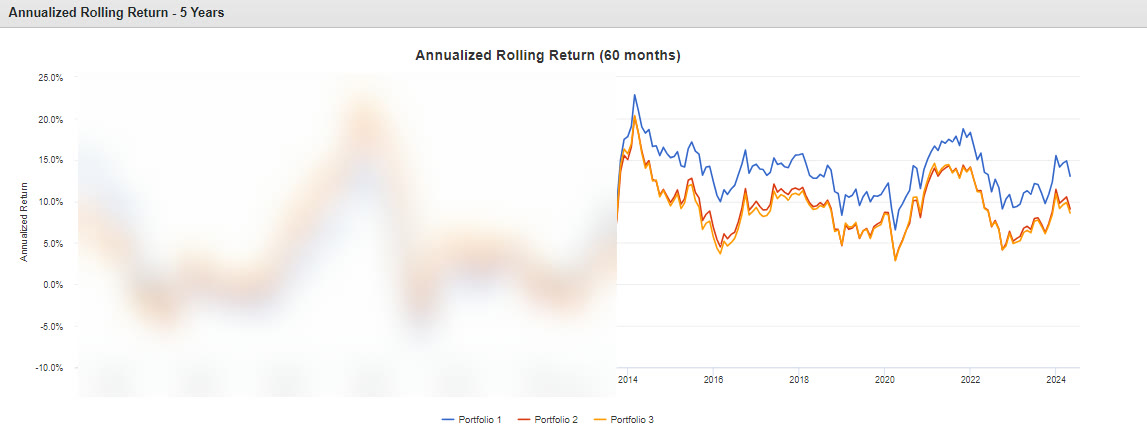
Rolling five-year returns: the last decade-plus favored the all-U.S. portfolio.
But markets are cyclical. Earlier, the 50/50 portfolio (red) and the one with emerging markets (yellow) crushed the U.S.-only portfolio for years.
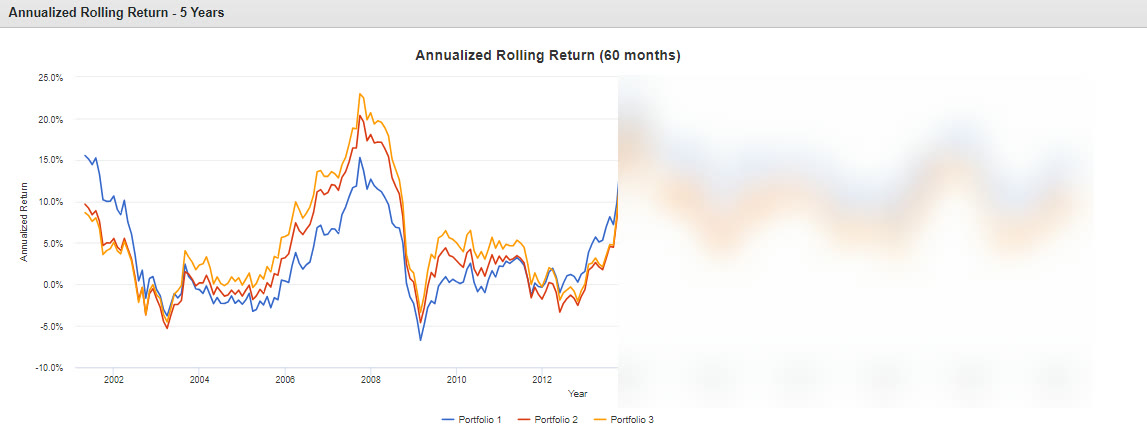
In the 2000s, the international and emerging markets mixes led for a long stretch.
Here’s the really interesting part. Over one-year periods, adding international and emerging markets increased both the upside and the downside, which makes sense because they’re riskier. But over five years and longer, the ups and downs were actually less extreme with them included. The U.S.-only portfolio had a 10-year period where it lost 3.51% a year, down over 30% in total, while the portfolio with international and emerging markets was roughly flat.
So adding riskier assets can lower a portfolio’s risk, because correlation matters. Owning something that zigs when the rest zags reduces the chance of being caught on the wrong side of one big bet. A 10–20% international slice isn’t mainly about higher returns. It might deliver them, but it’s really about diversification.
Step 3: A Mental Trick to Stick With the Plan
The last piece is mental accounting: setting aside separate buckets of money in your mind for separate goals, even if they sit in the same account. Look it up and you’ll find it described as a mistake, because mathematically a dollar is a dollar. That’s true for a robot. For humans, it can be very helpful.
Say someone is scared of the stock market and wants everything in “safe” cash and bonds. Run the same retirement example with a 3% return, and the calculator says they’d need to save 56% of their income.
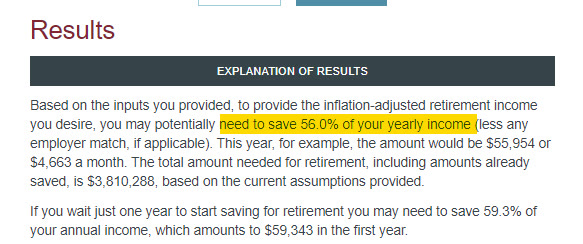
At a 3% return, the same plan needs a 56% savings rate. In other words, it won’t work.
Mental accounting offers a way through. The idea is to set aside whatever amount makes an investor feel safe, such as three or six months of expenses or a realistic worst case, in something ultra-safe, like savings or a money market fund. Investing the rest in stocks then tends to feel easier, because that money isn’t needed for emergencies or for the next 20 or 30 years.
Does that make your allocation slightly less than mathematically perfect? Technically, yes. But in the real world, finding a plan that works and sticking to it matters far more than engineering the perfect portfolio.
The same idea helps with several goals at once. Someone who needs $50,000 for a house down payment in two years might keep that $50,000 somewhere ultra-low-risk, so a stock market drop doesn’t tempt them to sell. The rest can be invested for longer-term goals like retirement.
Putting It Together
Here’s the process professionals typically follow:
Starting from a baseline, like the target date allocations for your age or years until retirement.
Checking both tests: will the mix get you to your goal (a retirement calculator), and can you stick with it (rolling returns and drawdowns)?
Using backtests to compare stock/bond mixes, U.S. vs. international, and any extras like emerging markets or small caps.
Using mental accounting to separate goals, such as emergency savings, college, a house, a wedding or retirement, repeating the process for each and putting the pieces together.
That’s the same process a professional would use to build a personalized allocation. Everyone’s situation is different, and this is education, not advice, but these tools let you test the trade-offs for yourself.
Next, read The Ultimate Retirement Income Guide and How to Transition Your Investments as You Near Retirement.
Watch the Full Video
Want to Go Deeper? In the Fundamentals of Finance Academy, Ethan breaks down funds and current market events on a live call every other week, and members get the full archive of recorded calls. Learn more about the Academy →
This article is for educational purposes only and is not investment advice. Ethan is a CFA charterholder, but nothing here is a recommendation to buy or sell any security, and it does not take your personal situation into account. Past performance does not guarantee future results. Charts of index returns are for illustration only and don’t reflect the fees, expenses or taxes of any actual investment. Performance data and fund details are as of 03/31/2024 and will change; check each fund’s website for current figures.
