How to Transition Your Investments As You Near Retirement (Step-by-Step Guide)
About this article: This article is based on Ethan’s video, originally published on August 31, 2025. Because the written version was published later, returns, yields and fund details reflect data available at the time of the video and have likely changed since. Please check each fund’s website for current figures.
A member of our Fundamentals of Finance Academy recently asked how to move from a growth portfolio to an income portfolio as retirement approaches. He’s certainly not the only one wondering. In this guide I’ll cover the basics of how and why to adjust, when to start, how much to hold in stocks and bonds along the way, and a simple rebalancing approach that produced strong results in my testing.
The Short Version
Typical target date funds hold some bonds even at age 20. Over the last 50 years, the S&P 500 never lost money over any 20- or 30-year period.
Ethan’s practical glide path: 100% stocks until about 20 years before retirement, then shift 1.5–2% a year toward about 65–75% stocks.
Ethan’s personal approach: start considering the shift about 5 years out, and use the Shiller P/E to decide when to begin.
In retirement, adding to stocks after market drops and trimming back at new highs beat a standard 60/40 portfolio by about 1.5% a year over the 10 years he tested.
The Basics: Why You Get More Conservative
Earlier in life, investors typically hold more stocks because they have higher long-term return potential than almost anything else, certainly more than bonds. They fall sometimes, but there’s time to recover. And for someone still contributing, a falling market means buying shares cheaper, so volatility can work in their favor.
After someone stops working, portfolios usually become more conservative: still some stocks, but fewer. Retirees rely on their investments for income and have less time to recover from losses, so short-term risk matters more.
The Standard Approach: Target Date Funds
Many people hold a target date fund in their 401(k). The “date” is your planned retirement year, and the fund gets more conservative over time along what’s called a glide path. Vanguard’s popular series is a good example, and most companies work about the same way: roughly 90% stocks in the “early career” phase, reductions starting around age 40, and a gradual decline until age 72, after which it stays at about 30% stocks and 70% bonds.
Plenty of smart people design these, and many investors are well served by them. But I think there’s a better alternative, starting with the early years: these funds hold about 10% in bonds from age 20. That seems crazy to me.
Why Bonds Make Little Sense at 20
Over the last 50 years, the odds of losing money in the S&P 500 over any 20- or 30-year period were zero. Through the oil embargo, the dot-com bust, 9/11, the 2008 financial crisis and a once-in-a-century pandemic, it never happened once.
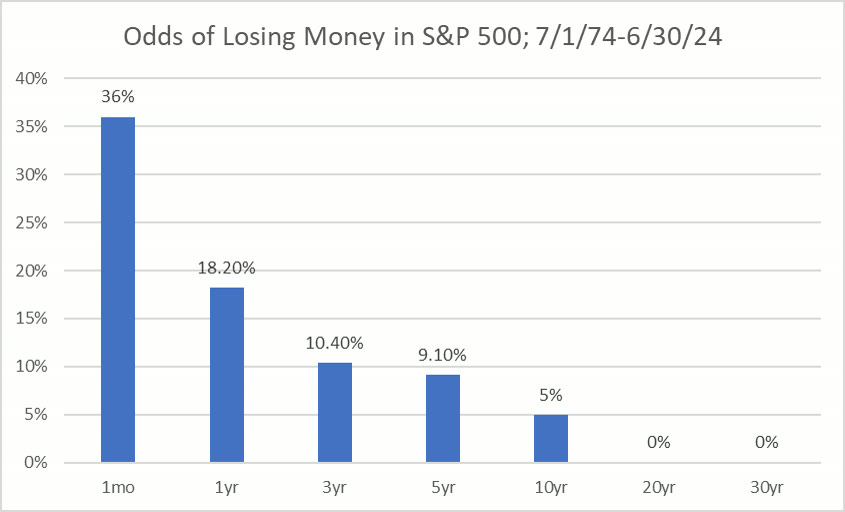
Odds of losing money in the S&P 500, July 1974 to June 2024: 36% over a month, 9.1% over 5 years, 0% over 20 and 30 years.
In fact, the worst 30-year return was 9.3% a year, better than the best 30-year return in bonds. ThatThat’s why, in Ethan’s view, bonds make little sense at 20.rsquo;s why I think bonds make little sense at 20.
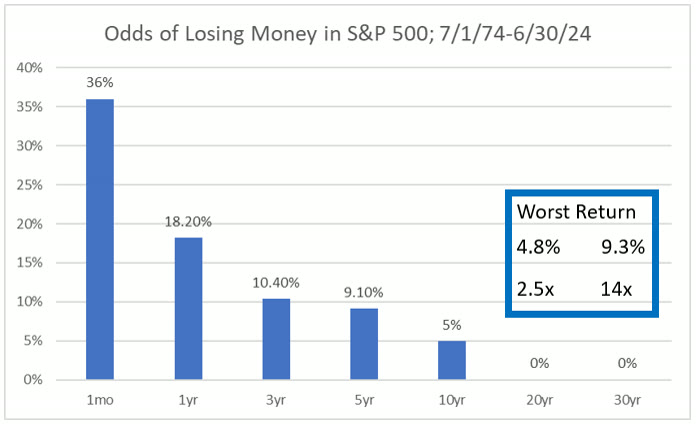
Worst annualized returns: 4.8% over 20 years and 9.3% over 30 years, multiplying your money about 2.5 and 14 times.
When Should the Transition Start?
The honest answer: we don’t know, because nobody can predict the market’s peak. If we could, that would be the time. But we can improve the odds. Since the chance of losing money over 20 years in the stock market has been very low (zero over the last 50 years, but let’s just call it very, very low), I think the transition shouldn’t start until someone is less than 20 years from retirement.
From there I’ll give two versions: the practical answer, and what I’d personally do, given that I’m very comfortable with market risk after a career in investing.
The Practical Answer
Here’s how I think about a typical path: a gradual shift from 100% stocks to about 65% stocks, give or take, starting about 20 years before retirement. For someone retiring at 65, that could mean 100% stocks until 45, then reducing stocks by about 1.5–2% a year until 65.
In my research, about 75% stocks has actually been optimal through retirement, if the stocks are well diversified and on the conservative side, like quality dividend-paying companies. With more aggressive stocks, a smaller allocation would be needed for the same level of risk. (I’d consider the S&P 500 more aggressive than what I mean for a retirement portfolio.) The bonds should be high quality too. Junk bonds with huge yields tend to fall when stocks fall, which defeats the purpose: bonds are there to hold steady when stocks drop.
So conventional wisdom says 60% stocks and 40% bonds. My research points to 75/25, as long as both sides are conservative. To build the income side itself, see The Ultimate Retirement Income Guide.
What I Would Personally Do
Given my risk tolerance, I’d wait longer and base the timing on the market. My approach has two parts.
Part 1: when to start considering it: about 5 years before retirement. The odds of losing money over 5 years in the stock market have been roughly 8–11%; my own research put it at 9.1% over the last 50 years. Starting to de-risk 5 years out doesn’t guarantee a better result. But if bonds earn a low, bond-like 2–4%, I’d estimate the odds of being better off staying in stocks for those final 5 years at roughly 85–90%. Personally, I’ll take those odds.
Part 2: when to actually start: use the Shiller P/E.
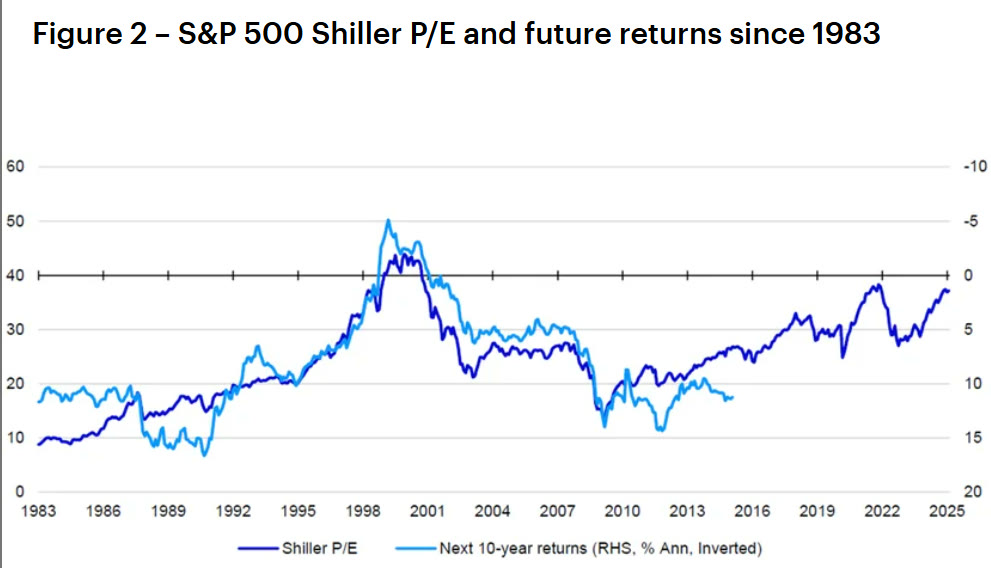
The Shiller P/E (dark blue) and the S&P 500’s return over the following 10 years (light blue, inverted).
The Shiller P/E measures how expensive the stock market is, and the more expensive it is, the lower future returns have tended to be. It isn’t perfect or guaranteed, but historically it’s been a decent directional guide. It predicts long-term returns much better than short-term ones, so it won’t warn you of an imminent crash. Still, if it were above 30 and I were 5 years from retirement, I’d start gradually getting more conservative, maybe moving 5% from stocks to bonds each year for 5 years until I reached a 75/25 mix. There’s no silver bullet for market timing, but this is widely considered one of the better indicators, and it’s easy to find with a quick search.
A Simple Way to Enhance Returns in Retirement
This is something I’ve already shared with our Academy members. It rests on three widely accepted ideas:
Stocks generally beat bonds in good times and trail them in bad times.
So you can improve returns by owning more stocks when the market is rising than when it’s falling.
The stock market has always eventually recovered after a decline.
I started with a standard 60/40 portfolio of SPY (the S&P 500) and BND (U.S. bonds), rebalanced once a year. Rebalancing means resetting to your target mix, since some investments always grow faster than others. Over the 10 years to June 30, 2025, that baseline returned 9.02% a year.
Then I tested the same portfolio with one rule: add to stocks as the market falls, and trim back once it recovers.
S&P 500 down 10% from its peak (a correction): move to 70/30.
Down 20% (a bear market): 80/20.
Down 30%: 90/10.
Down 40%: 100% stocks.
When the S&P 500 recovers to its prior peak (on a total return basis), sell the extra stocks and go back to 60/40 until the next correction.
That portfolio returned 10.53% a year over the same 10 years, about 1.51% a year more, which works out to roughly $350,000 more on a $1 million portfolio.
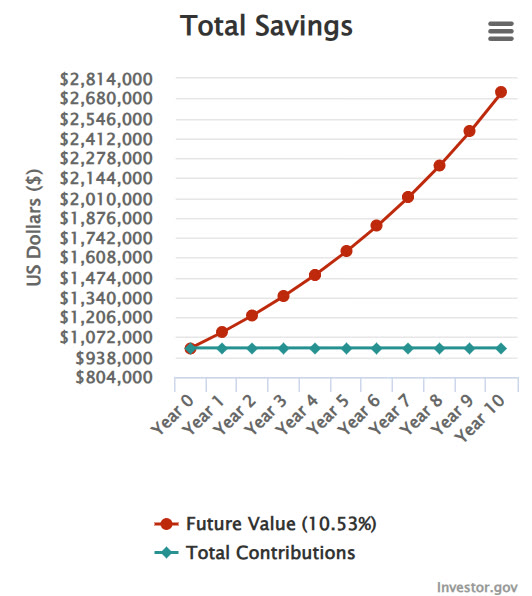
$1 million growing at 10.53% a year for 10 years.
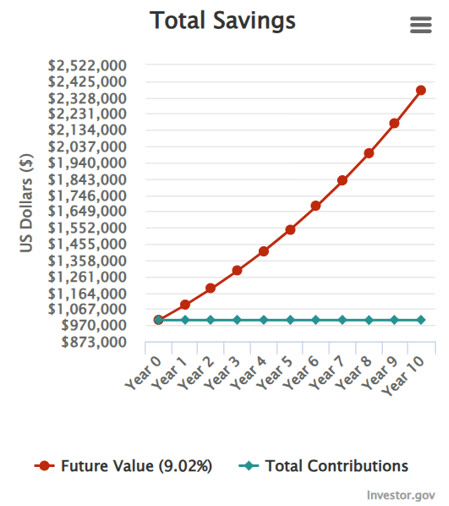
The same $1 million at the standard portfolio’s 9.02% a year.
Over that 10-year test, it would have beaten almost every balanced mutual fund in the industry, and the same was true over the last 3 and 5 years, when it beat the standard 60/40 by 1.95% and 1.69% a year. The edge will vary with market conditions, and I didn’t test further back because the research was extremely time-consuming. These are hypothetical backtests, not guarantees. But conceptually, I struggle to see it failing to help over a 10-plus-year period unless the market simply kept falling forever, which is practically impossible.
New to building a portfolio? Start with Asset Allocation: The Ultimate Guide.
Watch the Full Video
Want to Go Deeper? In the Fundamentals of Finance Academy, Ethan breaks down funds and current market events on a live call every other week, and members get the full archive of recorded calls. Learn more about the Academy →

This article is for educational purposes only and is not investment advice. Ethan is a CFA charterholder, but nothing here is a recommendation to buy or sell any security, and it does not take your personal situation into account. Past performance does not guarantee future results. Charts of index returns are for illustration only and don’t reflect the fees, expenses or taxes of any actual investment. Performance data and fund details are as of 06/30/2025 and will change; check each fund’s website for current figures.
