Top U.S. Quality ETFs Reviewed by a CFA Charterholder
About this article: This article is based on Ethan’s video, originally published on September 25, 2026. Because the written version was published later, returns, yields and fund details reflect data available at the time of the video and have likely changed since. Please check each fund’s website for current figures.
Factor Investing Series: you’re reading Part 9 of 11
Part 1: Momentum Investing Explained
Part 2: SPMO vs MTUM
Part 3: Small-Cap Investing Explained
Part 4: Top Small-Cap ETFs
Part 5: Value vs Growth Stocks
Part 6: Best Value ETFs
Part 7: Quality Factor Investing Explained
Part 8: Top International Quality ETFs
Part 9: Top U.S. Quality ETFs (you’re here)
Part 10: Minimum Volatility Investing Explained
Part 11: Best Low Volatility ETFs
Welcome back to our series on factor investing, and the grand finale of its quality portion: my top U.S. quality funds. I started with a universe of over 1,500 mutual funds and ETFs, and only 12 passed my tests. Here I’ll show the best of the best, in my opinion. I used to teach financial advisors how to evaluate funds for a living, so even if you’re not interested in quality factor investing, you should still learn something about evaluating funds in general.
The Short Version
1,500+ U.S. funds went through the quality screen, 422 passed it, and only 12 also had consistently strong results.
Active winners (tied): RJCA, RJ ClariVest Capital Appreciation ETF (quality growth with valuation discipline), and Elfun Trusts (a 0.17% mutual fund from 1935, not growth-oriented).
Passive winner: the Nasdaq-100 (QQQ/QQQM). It beat everything objectively, though I personally wouldn’t buy it right now.
The fund I teased in Part 7 is Fidelity Blue Chip Growth. It’s extraordinary, but it’s a high-octane growth fund, not a quality pick.
How I Screened 1,500+ U.S. Funds
Here’s a peek behind the scenes at the three-step process:
Consistently high quality. I took all U.S. large-cap value, blend and growth funds and kept only those that have never fallen out of the top half for Morningstar’s quality factor exposure at any point in the past 10 years. Astute readers will remember I used the top third for international funds. Why the top half here? Because the U.S. has such a strong growth bias, and growth and quality are strongly correlated. I didn’t want a list of nothing but high-growth funds; I wanted to see whether any funds mixed quality with value or dividends, and those might score a little lower on quality.
Consistently strong results. I looked at rolling five-year success rates against the S&P 500 and the Russell 1000 Growth over the past 10, 20 and 30 years, favoring longer, consistently successful track records over short lucky streaks. It’s easy to get a particular kind of exposure in an ETF; it’s much harder to do it effectively and consistently. The quality screen took us from 1,500+ funds to 422. The consistency screen took us from 422 to just 12.
Repeatability. I researched how each finalist uses quality and whether its results are likely to be repeatable, and picked funds that do it in different ways, since investors have different preferences.
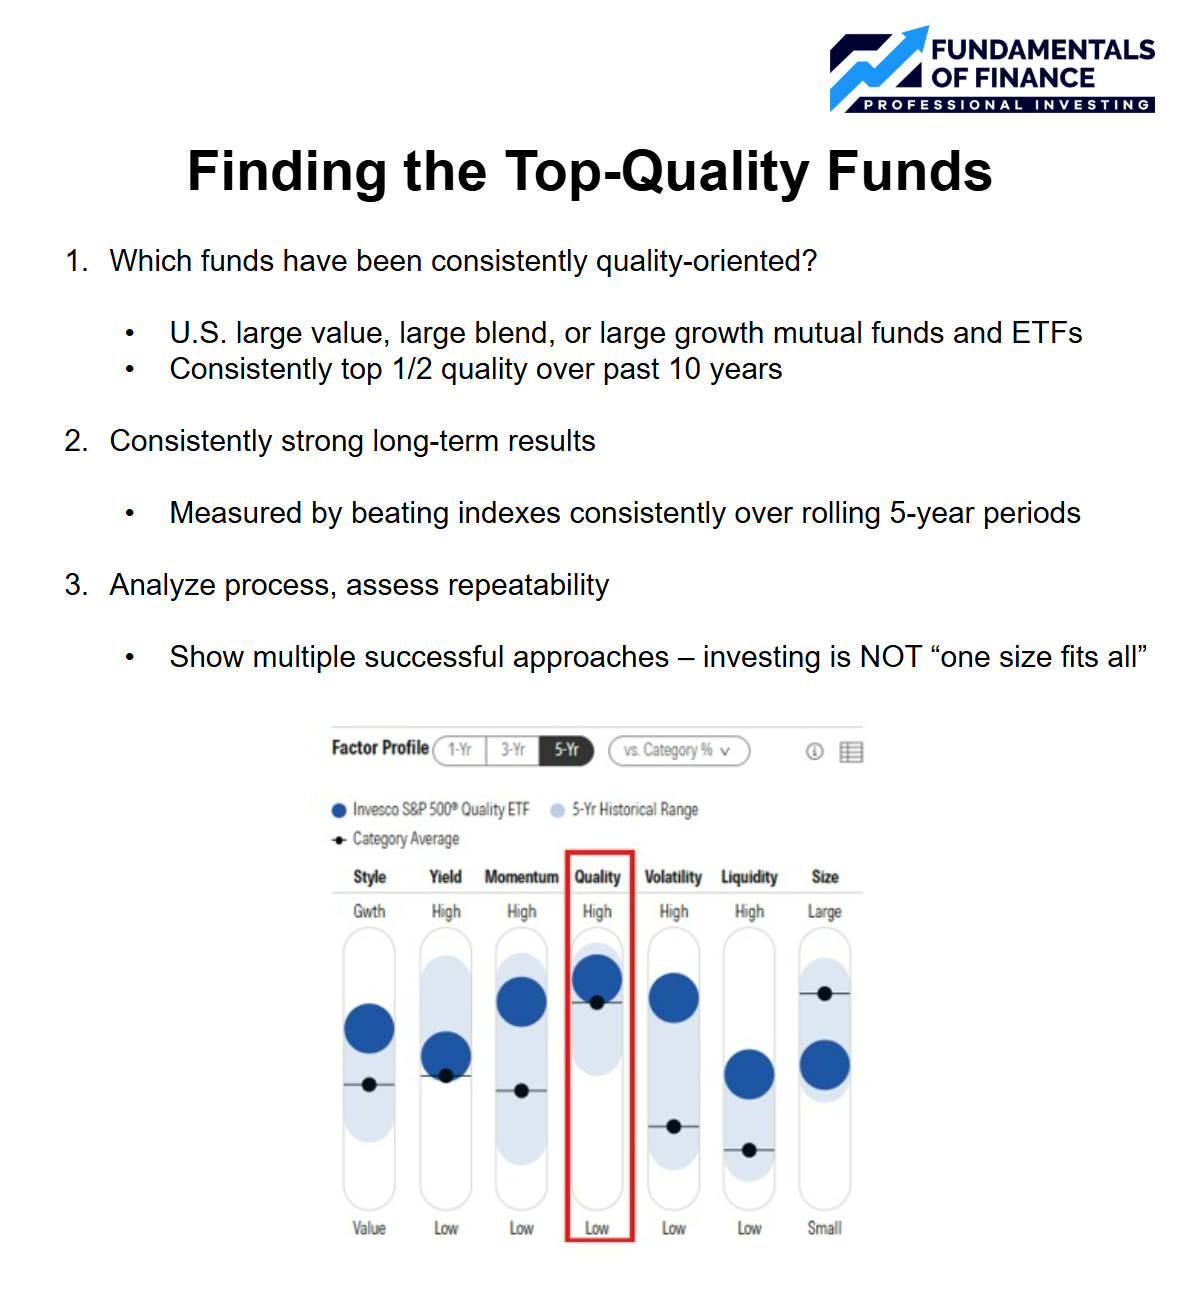
The three-step screen for U.S. funds.
The Runners-Up
Before the winners, a quick look at some close runners-up, since many of you asked for that after the last part.
T. Rowe Price Growth Stock: A Manager Change
T. Rowe Price Growth Stock has an extraordinary track record. It’s more growth-oriented than quality-oriented, though there are some quality elements to its process. The mutual fund has been so good that it’s closed to new investors, but it now has an ETF that you can buy (TGRW).
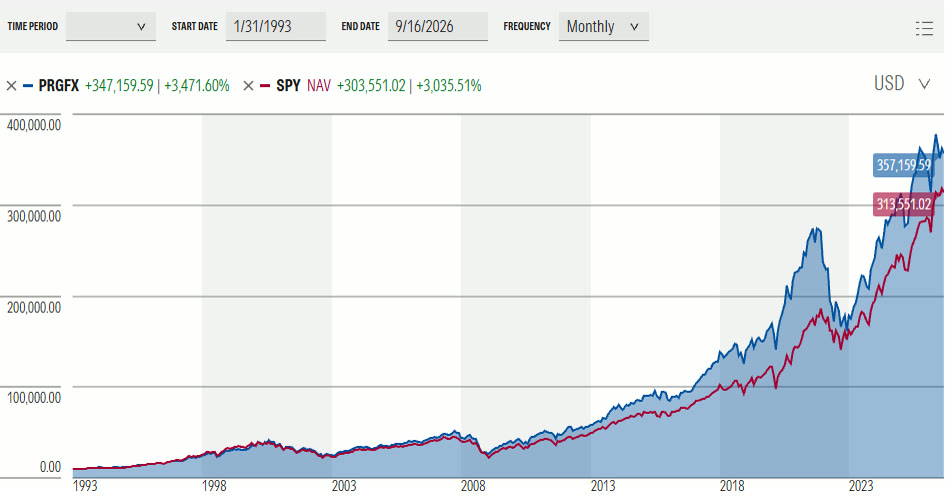
T. Rowe Price Growth Stock (blue) versus SPY (red) since 1993.
Unfortunately, they replaced their long-time portfolio manager in 2025, so we have no idea whether that record is repeatable, and that rules it out for me. You can see this for any fund on Morningstar by opening its “People” tab. It’s absolutely crucial for evaluating active managers, especially single-manager funds like this one: when that manager inevitably retires or leaves, you have no idea what to expect next.
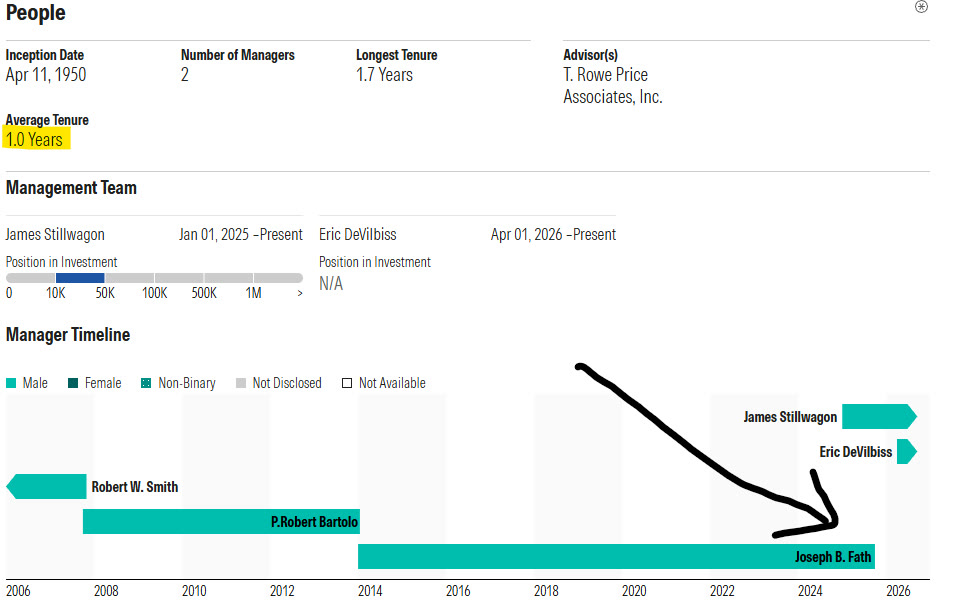
Morningstar’s People tab: the long-time manager handed over in 2025 (arrow).
That’s why I generally favor funds with multiple portfolio managers who each run a portion of the portfolio independently, like Capital Group’s American Funds (same company, two brands) and PRIMECAP, or at least a team approach, like Dodge & Cox. A great single manager can be great, but you need to watch for when they leave and consider making a change — which you don’t have to do when a consistent, repeatable process drives the results rather than one savant who’d be hard to replace. Fidelity Contrafund, another fund that hit all my screens, recently had a legendary single manager retire too; we’ve covered it, and some replacement ideas, in earlier videos.
JPMorgan Growth Advantage
Pretty solid over the past 20 years, but it’s really a growth fund more than a quality fund, it doesn’t come in an ETF, and it also replaced its long-time portfolio manager in 2023.
The Big Reveal: Fidelity Blue Chip Growth
Now, what you’ve been waiting for: the mystery fund with the amazing track record from Part 7. Drum roll, please… it’s Fidelity Blue Chip Growth Fund, which has absolutely trounced IWF, the leading growth ETF, since IWF came out in 2000.
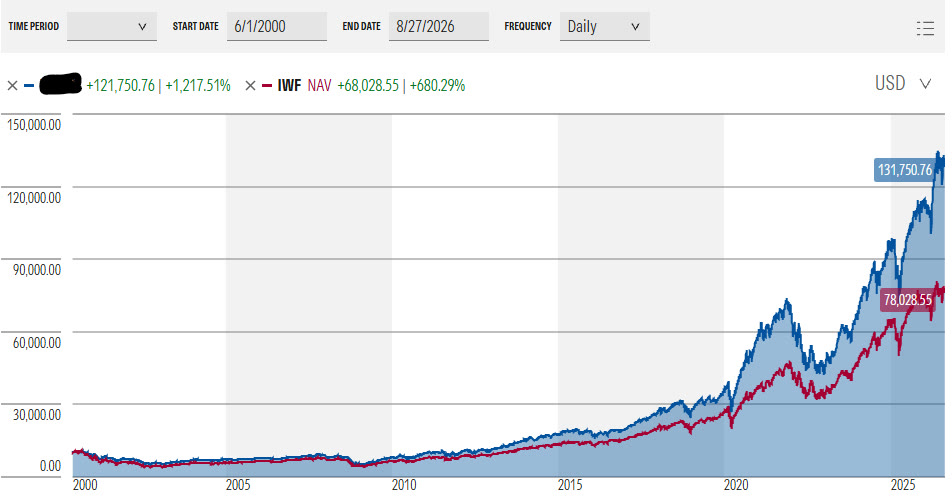
Fidelity Blue Chip Growth (blue) versus the Russell 1000 Growth ETF IWF (red) since 2000.
It’s also crushed the S&P 500 since SPY’s 1993 launch. Most of that came during the growth rally that began in 2013, when growth was heavily in favor — fair enough — but it also beat the growth ETF and almost every growth fund in its category during that time. Just as important, the portfolio manager responsible for that entire record still runs the fund today.
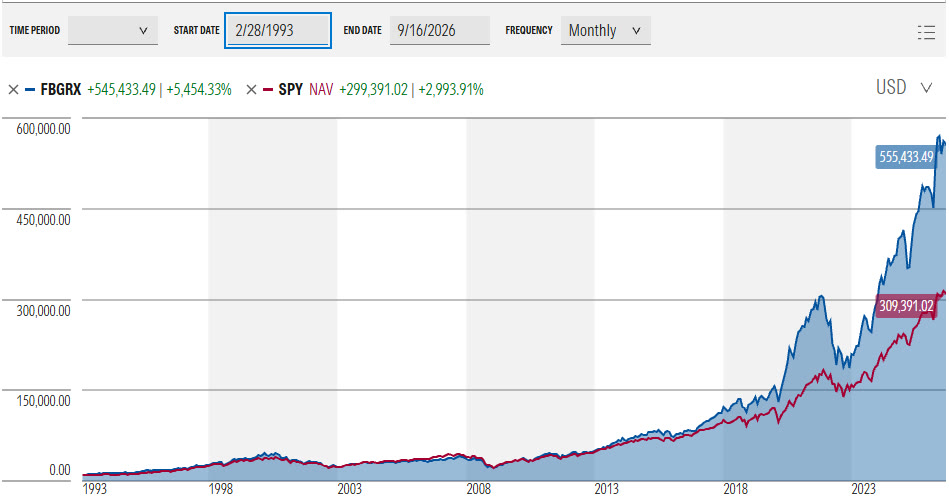
Fidelity Blue Chip Growth (blue) versus SPY (red) since 1993.
So why isn’t it my winner? Because despite a name that suggests blue chips — high-quality, well-established companies — this manager doesn’t really invest that way. It’s a high-octane, high-growth fund through and through. It passed the quality screen because growth is so correlated with quality, but it doesn’t deliver the steady-Eddie return profile, with some protection in down markets, that people usually want from the quality factor. Its Morningstar risk score of 88 puts it in the “very aggressive” range.
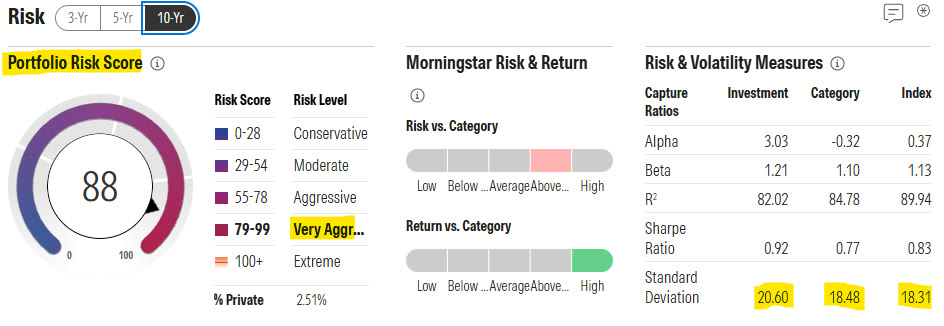
A Morningstar risk score of 88: very aggressive. Source: Morningstar.
So it’s a great fund, just not a quality pick. If that profile and its holdings don’t scare you, it’s available as an ETF under the ticker FBCG.
Active Winner #1: RJCA, RJ ClariVest Capital Appreciation ETF
For my two active winners, I honestly couldn’t choose between them, but they appeal to different investors for different reasons, so you may have a clear preference.
The first is the RJ ClariVest Capital Appreciation ETF (RJCA), which was recently converted from a mutual fund into an ETF — something I didn’t even know was possible, despite being involved in launching multiple mutual funds and ETFs. There’s one important caveat: because of the conversion, it may be more likely than a native ETF to pay out capital gains, like a mutual fund, so it may be a little less tax efficient in its first few years. Even so, there’s a lot to like.
I’d call it quality growth; they call it “growth with discipline.” Along with earnings growth, they also consider valuation, and that more disciplined approach has led to a lower volatility profile than the typical growth fund, and much lower than Fidelity Blue Chip Growth. It’s also been very consistently high quality.
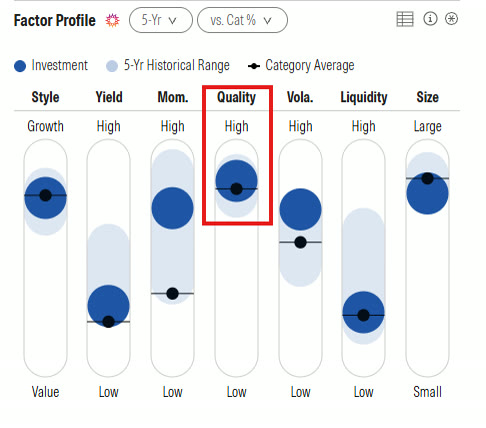
RJCA’s factor profile: consistently high quality (highlighted). Source: Morningstar.
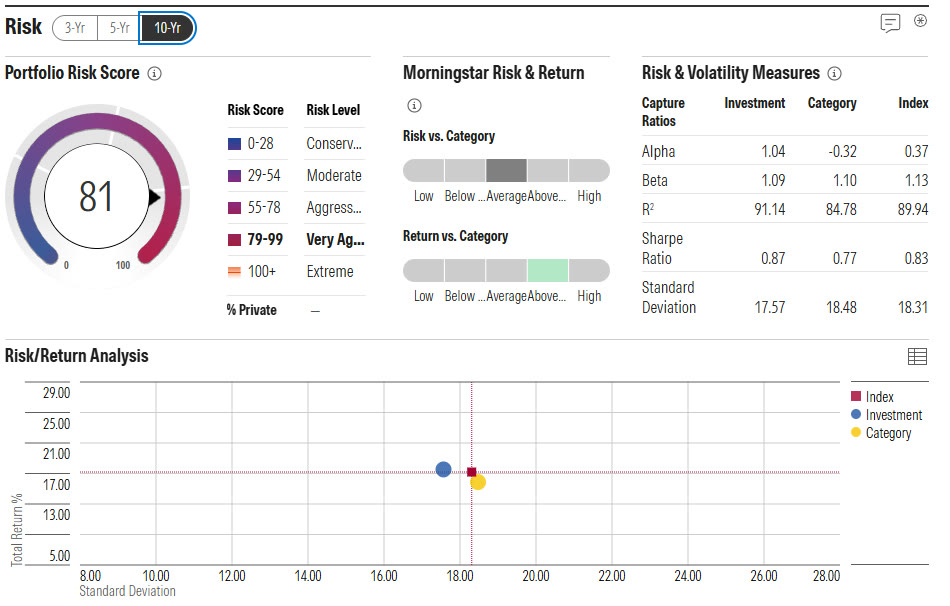
RJCA’s risk score of 81: lower than Fidelity Blue Chip Growth’s 88. Source: Morningstar.
Two of its four portfolio managers have run the fund for more than 13 years, and another for nearly 10. While you give up a little return compared with higher-octane options in strong growth markets, it’s trounced SPY since its most tenured managers took over, and it has beaten the S&P 500 index in more than 80% of five-year periods since its inception. That’s pretty dang solid.
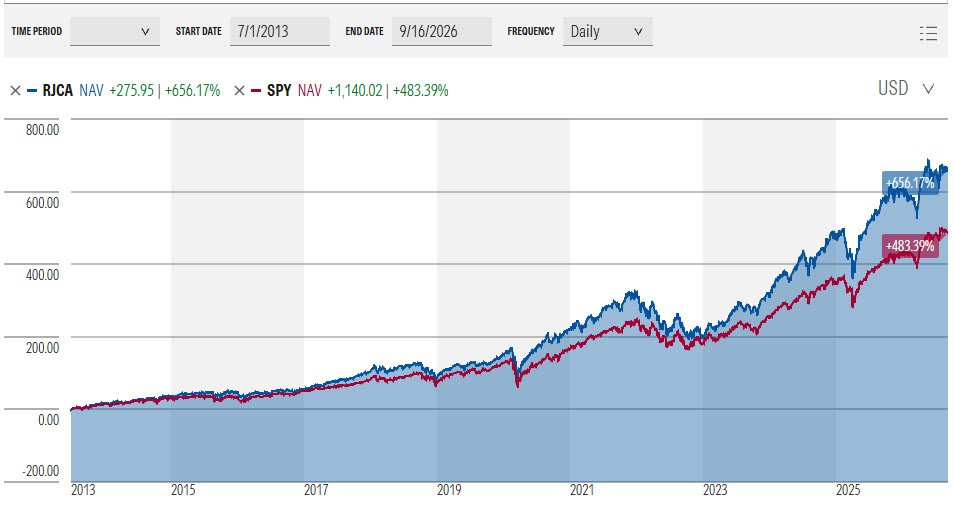
RJCA (blue) versus SPY (red) since 2013, when its most tenured managers took over.
Active Winner #2: Elfun Trusts
Tied with RJCA is Elfun Trusts (ELFNX). It isn’t necessarily better than RJCA, just a better fit for certain tastes. It’s only available as a mutual fund, but it’s much cheaper than any active ETF in this review at just 0.17%, and it’s been around since 1935, making it one of the oldest mutual funds in the industry.
One key difference from every other fund here: it’s not growth-oriented. Within its own category it has been consistently high quality, though these bars aren’t directly comparable across categories, so it scores a bit lower on quality than most of the growth funds. But it also has a much lower risk score and has been far less volatile than anything else in this review. If you want a true quality return profile, without unintentionally leaning into growth after a decade-plus hot streak, I think it’s a solid option.
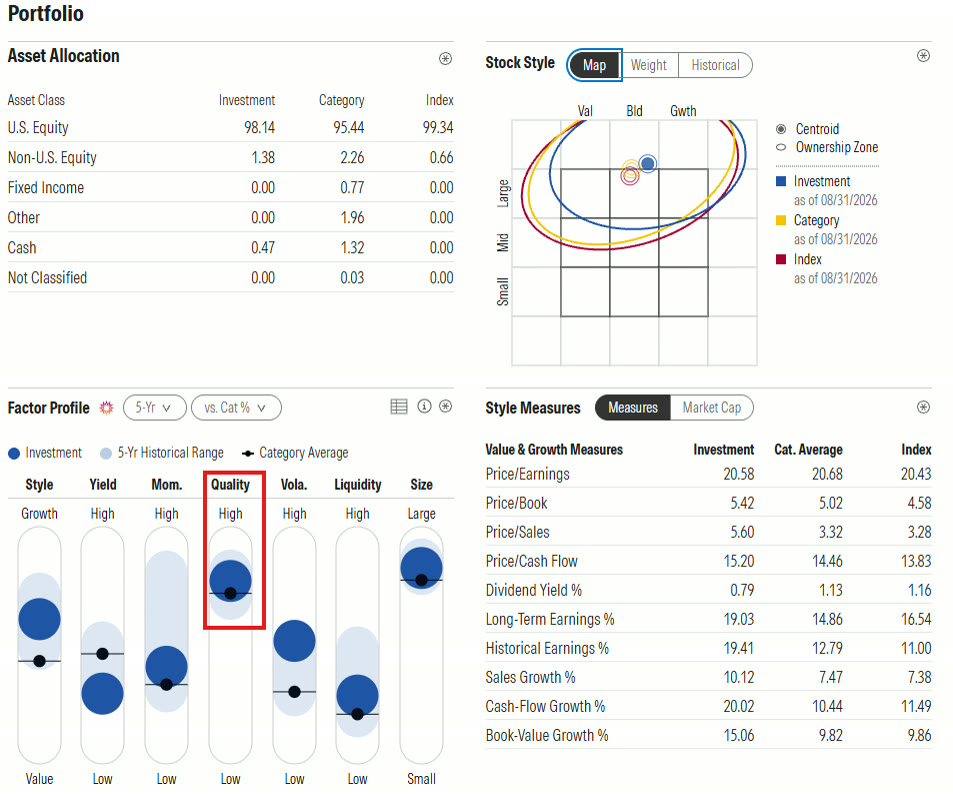
Elfun Trusts: consistently high quality within its large-blend category. Source: Morningstar.
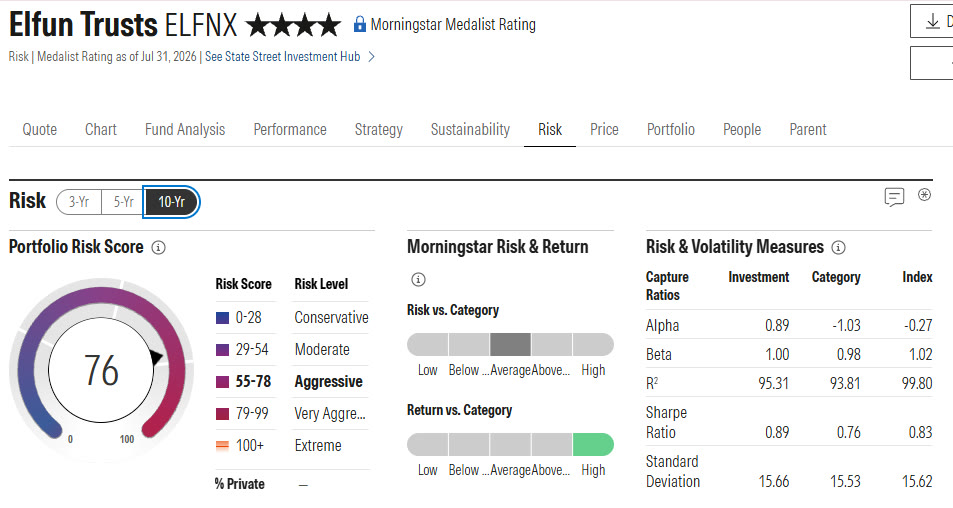
A risk score of 76: the lowest of the funds in this review. Source: Morningstar.
Its quality tilt starts with its objective: long-term growth of capital and future income. I hadn’t seen that before, but for a company to pay future income, it basically has to be consistently profitable — a key quality trait. Beyond above-average growth, the managers look for appropriate capital structures (not loaded with debt), industry leadership (which supports durable earnings) and high-quality management focused on creating shareholder value through growth, buybacks and dividends. Many of those line up with the quality factor, which is why it’s been consistently high quality despite not being a growth fund.
That process, plus ultra-low fees, has produced a significantly better record than SPY since SPY’s inception, and a nearly 80% success rate against the S&P 500 across all rolling five-year periods over the past 30 years — even higher over the past 20.
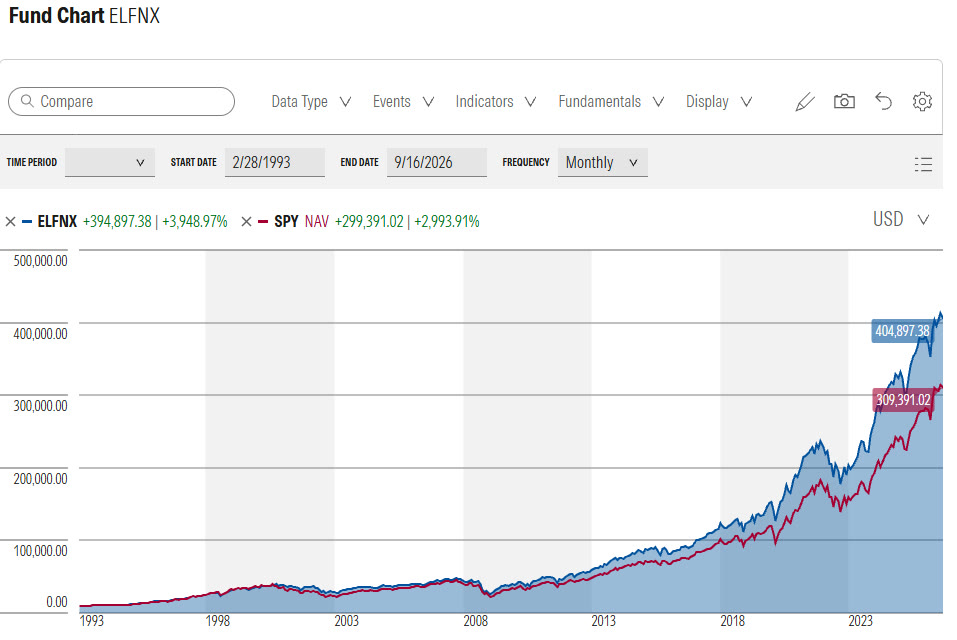
Elfun Trusts (blue) versus SPY (red) since 1993.
I don’t love that it’s run by a single portfolio manager now that the other one has left. But it has beaten the S&P since he joined the fund, and he’s relatively young, so he should be able to stick around a long time if he chooses to and keeps performing.
Passive Winner: The Nasdaq-100 (QQQ / QQQM)
And finally, the passive winner. I can’t believe I’m saying this, but the Nasdaq ETFs really just decimated everything else. Using QQQ as the proxy, it has beaten the S&P 500 in every single five-year period over the last 20 years, and the Russell 1000 Growth 96% of the time.
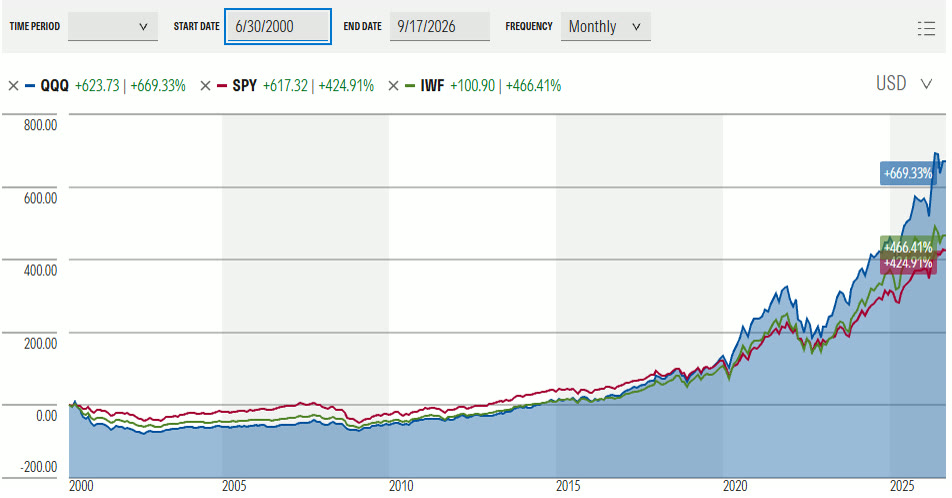
QQQ (blue) versus SPY and IWF since 2000.
It did pretty poorly in the tech crash and took a long time to recover, and it’s been crushing it again in the recent tech rally. I personally wouldn’t put money into it right now, because I’m convinced we’re in an AI spending bubble and the Nasdaq probably won’t do well if it bursts. But objectively, it dominated every other passive option I looked at.
It’s not low volatility by any means, but it’s been very consistently high quality — higher than most quality-specific ETFs I looked at, over 10 years, not just the five Morningstar shows. Its risk score has been high, but not that high compared with its U.S. growth peers, and lower than Fidelity Blue Chip Growth’s.
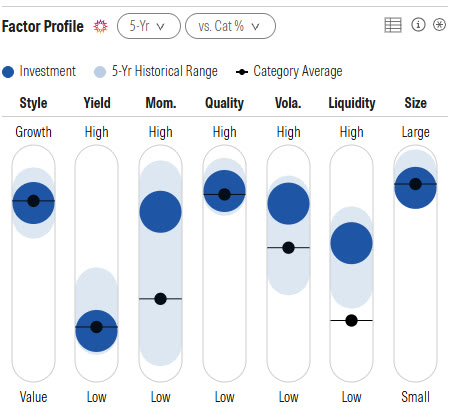
QQQ’s factor profile: consistently high quality. Source: Morningstar.
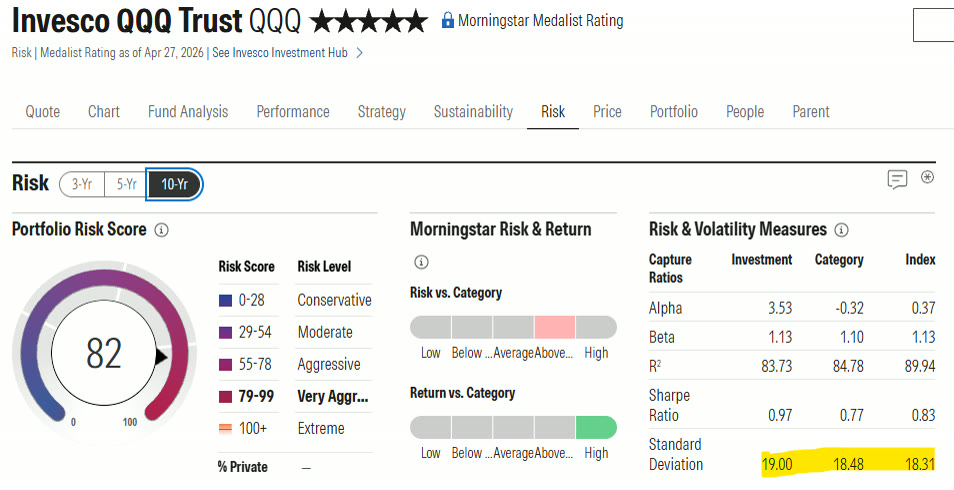
QQQ’s risk score of 82. Source: Morningstar.
Why the Nasdaq-100 Screens as Quality
What I didn’t realize is that some quality-oriented requirements go into Nasdaq inclusion. To be in the Nasdaq-100, which QQQ tracks, a company has to be listed on one of Nasdaq’s two higher tiers. The Nasdaq Global Market criteria aren’t that strict, but that tier is more for mid caps. The Nasdaq Global Select Market is for larger companies, and it matters most, since the Nasdaq-100 includes only the largest 100 qualifying companies. Getting in requires financial standards like three consecutive years of positive pre-tax earnings and positive cash flows, plus minimum revenue and assets. And every tier requires a majority-independent board, an audit committee, regular shareholder meetings and minimum trading volume.
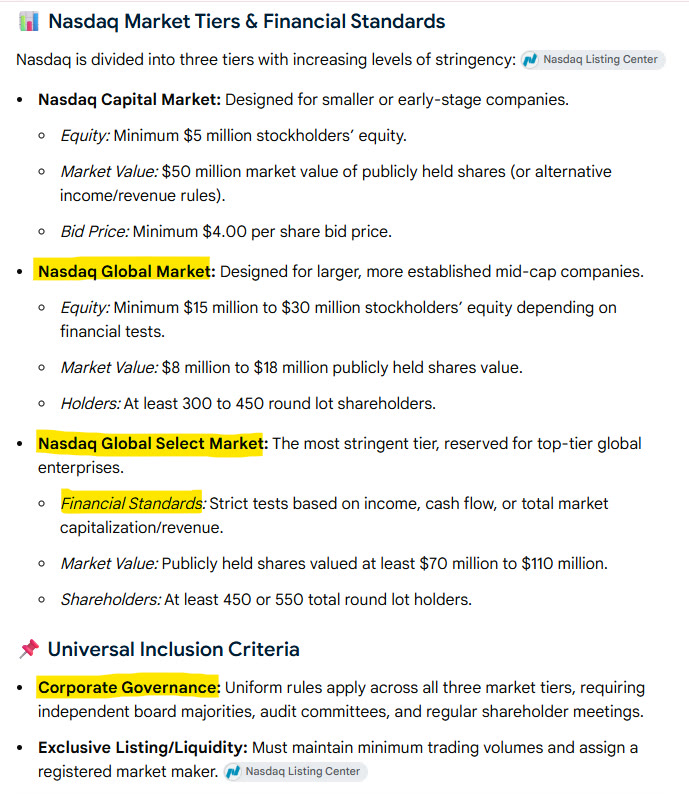
Nasdaq’s listing tiers and standards, including the profitability and governance requirements.
That is… unless you’re SpaceX, for which Nasdaq reportedly bent its rules. So how passive is QQQ really? That’s your call, but you can track the same index with QQQM for just 0.15%.
How the U.S. Quality Picks Compare
RJCA (active ETF): quality growth with valuation discipline, a long-tenured team, and less volatility than typical growth funds. Note the possible capital gains in its first years after converting from a mutual fund.
Elfun Trusts, ELFNX (active mutual fund, 0.17%): not growth-oriented, the lowest risk score here, around since 1935. Fits an investor who wants a true quality return profile without a growth tilt.
QQQM / QQQ (passive, 0.15% for QQQM): the strongest passive record and consistently high quality, but not low volatility and heavily exposed to the AI trade.
Runner-up, FBCG (Fidelity Blue Chip Growth’s ETF): an extraordinary record, but high-octane growth rather than a quality profile.
Next in the series: low volatility.
Watch the Full Video
Want to Go Deeper? In the Fundamentals of Finance Academy, Ethan breaks down funds and current market events on a live call every other week, and members get the full archive of recorded calls. Learn more about the Academy →

This article is for educational purposes only and is not investment advice. Ethan is a CFA charterholder, but nothing here is a recommendation to buy or sell any security, and it does not take your personal situation into account. Past performance does not guarantee future results. Charts of index returns are for illustration only and don’t reflect the fees, expenses or taxes of any actual investment. Performance data and fund details are as of 09/25/2026 and will change; check each fund’s website for current figures.
