Do Low Volatility ETFs Actually Protect You? Minimum Volatility Investing Explained
About this article: This article is based on Ethan’s video, originally published on October 7, 2026. Because the written version was published later, returns, yields and fund details reflect data available at the time of the video and have likely changed since. Please check each fund’s website for current figures.
Factor Investing Series: you’re reading Part 10 of 11
Part 1: Momentum Investing Explained
Part 2: SPMO vs MTUM
Part 3: Small-Cap Investing Explained
Part 4: Top Small-Cap ETFs
Part 5: Value vs Growth Stocks
Part 6: Best Value ETFs
Part 7: Quality Factor Investing Explained
Part 8: Top International Quality ETFs
Part 9: Top U.S. Quality ETFs
Part 10: Minimum Volatility Investing Explained (you’re here)
Part 11: Best Low Volatility ETFs
If you’re a more conservative investor, saving toward a short- or medium-term goal, or worried about the risks or valuations in the market right now, this part of the series is for you.
Put your money under the mattress. The end. Just kidding. Nobody likes losing money on their investments, but the last thing we want is to go so far chasing lower volatility in the short run that we reduce our chances of meeting our goals in the long run, which is what ultimately matters.
The Short Version
Minimum volatility gives up some return potential, but aims to cut volatility by more than it cuts returns.
USMV keeps sector weights close to the market. SPLV simply buys the 100 least volatile S&P 500 stocks.
Across six downturns since 2011, both almost always lost less than the S&P 500, with SPLV usually losing least. The big exception was 2020.
What Is Minimum Volatility Investing?
Minimum volatility is the fifth and final factor in our factor investing series. All of these factors are characteristics that have led to better risk-adjusted returns than the market over time. Some, like momentum and small caps, have done it with higher returns and higher volatility. At the other end of the spectrum is minimum volatility, which does give up some return potential but is designed to limit volatility more than it limits returns, improving risk-adjusted returns.
In practical terms, it lets you get more conservative with your investments, for whatever reason matters to you, without going so far as stuffing money under the mattress, giving up all return potential and putting your actual goals at risk. Think of it like a buy-three-for-the-price-of-two sale, except instead of saving a bit of money, you’re saving a bit of volatility.
How Min Vol ETFs Work: USMV vs SPLV
Like most things in investing, there’s more than one way to do it. Here I’ll focus on factor investing; the next part, which covers the top low volatility ETFs, compares the factor ETFs with funds that limit volatility in other ways, like adding bonds or alternative assets that zig when stocks zag.
For now, I’ll use the two largest min vol ETFs, USMV and SPLV, to show how traditional minimum volatility investing works and how it has worked out. Even these two show how seemingly similar ETFs can be very different:
USMV (iShares MSCI USA Min Vol Factor ETF) stays fairly close to the broad index’s sector weights, so most of the time it still holds some tech, some energy and the other volatile sectors, just the least volatile companies within them.
SPLV (Invesco S&P 500 Low Volatility ETF) just buys the 100 least volatile companies in the S&P 500, full stop. If they’re concentrated in a few small areas of the market, so is the fund.
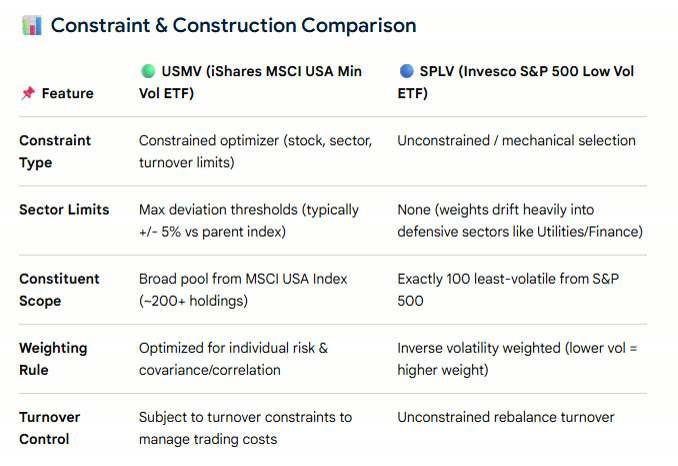
How USMV and SPLV are built: an optimizer with sector limits versus a simple list of the 100 least volatile stocks.
Either approach could work better in a given downturn. Before looking, my guess was that SPLV would do better in most downturns and probably have less long-term upside. But not all downturns are created equal. Sometimes one sector does much better or worse than the others, and it’s not always the same one.
In 2020, energy did horribly because oil prices went literally negative, while tech did amazingly because everyone was stuck inside buying new computers and Zoom subscriptions.
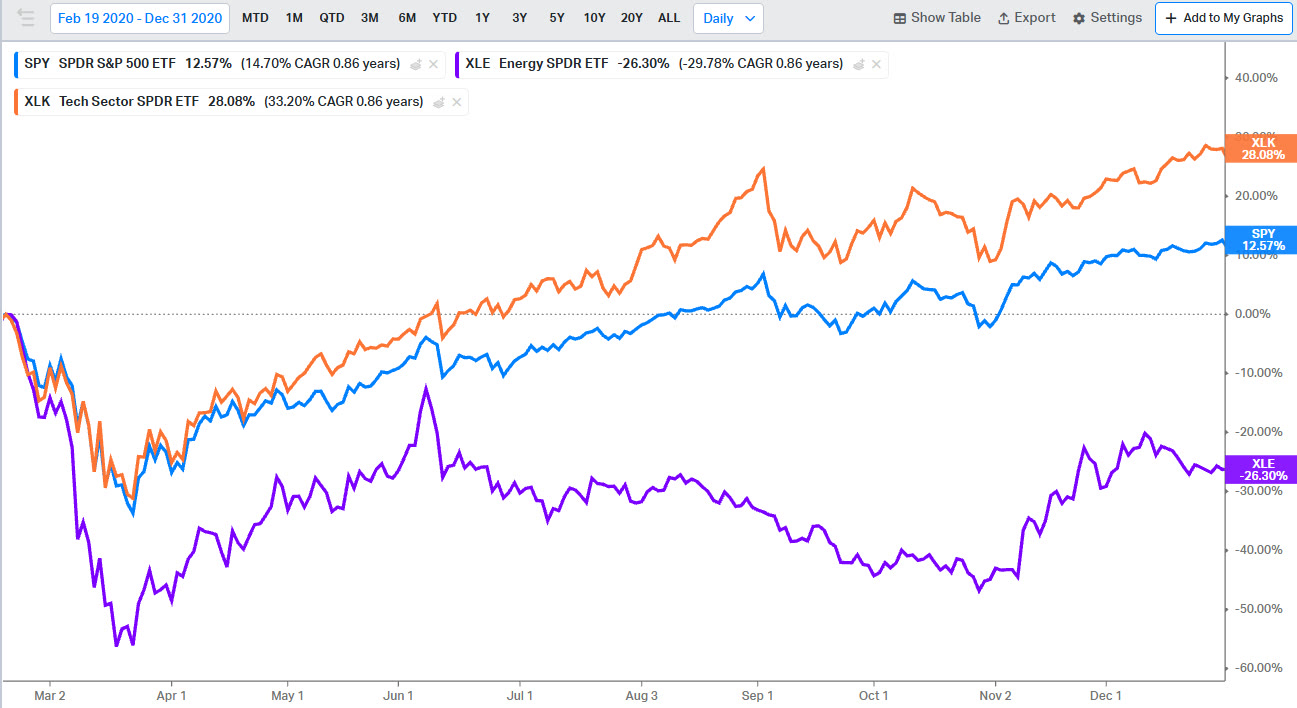
2020: tech (orange) soared while energy (purple) collapsed.
In 2022, energy did amazingly because the downturn was caused by an energy crisis, and tech did horribly because interest rates rose a ton and nobody wanted to be stuck at their computers anymore; they wanted to get back to living their lives.
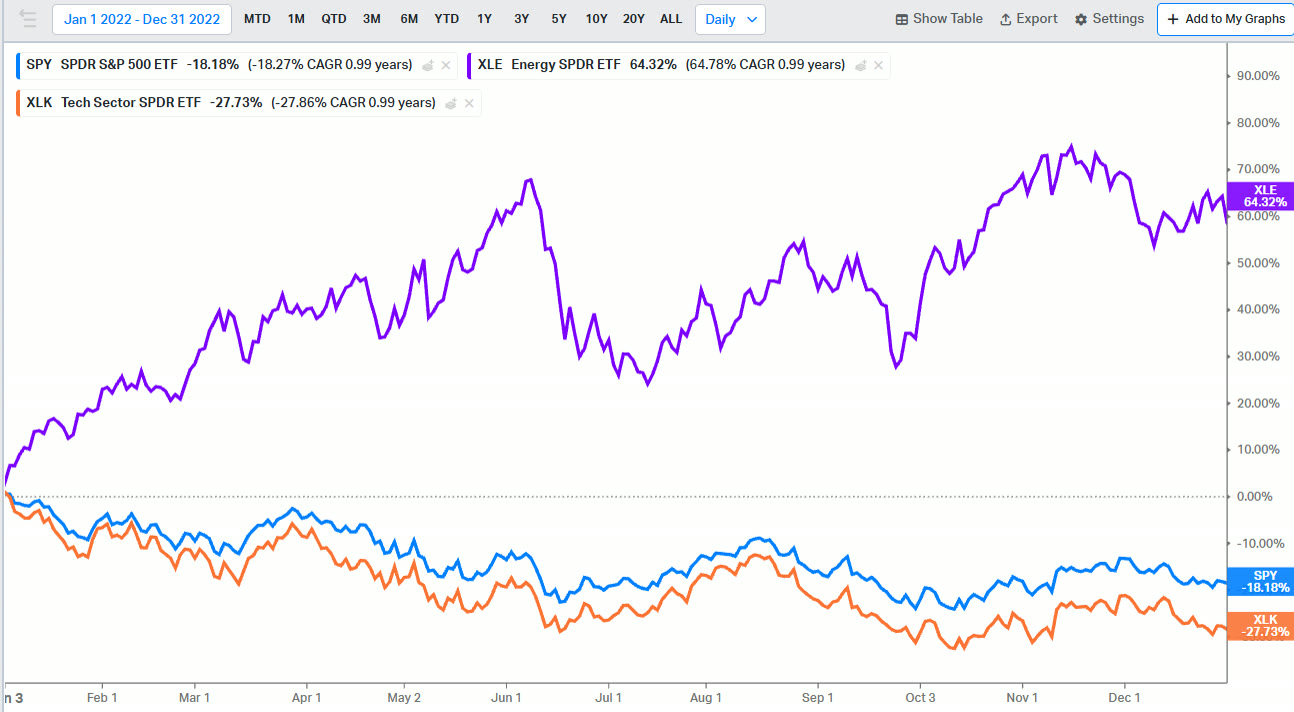
2022: energy (purple) soared while tech (orange) fell.
Six Downturns Tested
Min vol ETFs like USMV and SPLV have generally done better than the broad market in pretty much every downturn, and, as I expected, SPLV’s approach has limited losses better most of the time, but not all of the time. Working backwards:
2025: Liberation Day
Both ETFs significantly beat the S&P 500, barely falling at all, and SPLV did best. Then both lagged in the recovery, with SPLV lagging most. No surprise there.
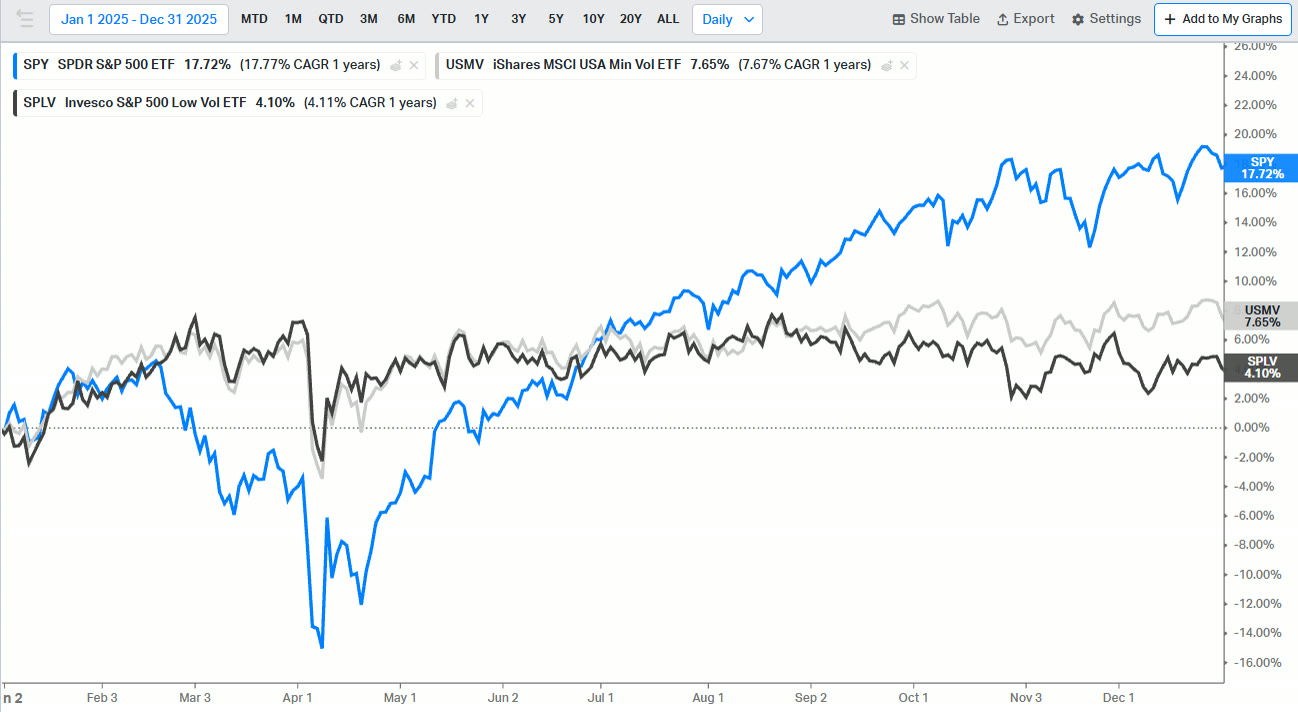
2025: SPLV (black) and USMV (grey) barely fell, then trailed SPY (blue) in the recovery.
2022
Both beat the S&P handily, and SPLV was best.
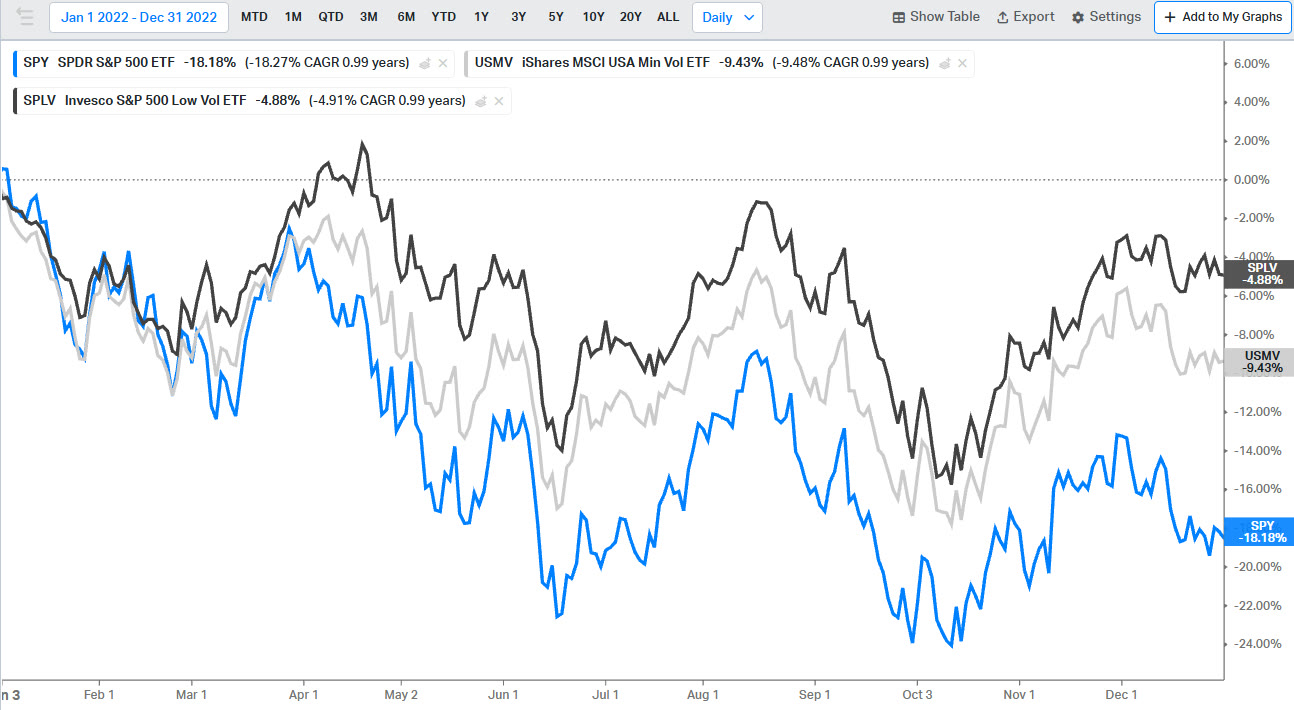
2022: both min vol ETFs held up far better than SPY (blue).
2020: The Exception
2020 was really the main exception. Both were pretty much in line with the S&P on the way down, because even the most conservative, high-quality businesses were being told to shut down or stop paying dividends, which for many of these companies is a key source of return. Meanwhile, plenty of volatile tech companies saw years of expected growth packed into a few months.
It’s hard to imagine many scenarios like that. Maybe another pandemic, or a zombie apocalypse? It would have to be something that keeps everyone indoors, because companies like McDonald’s generally don’t lose much business in a downturn; they might even gain some if people are trying to spend a bit less.
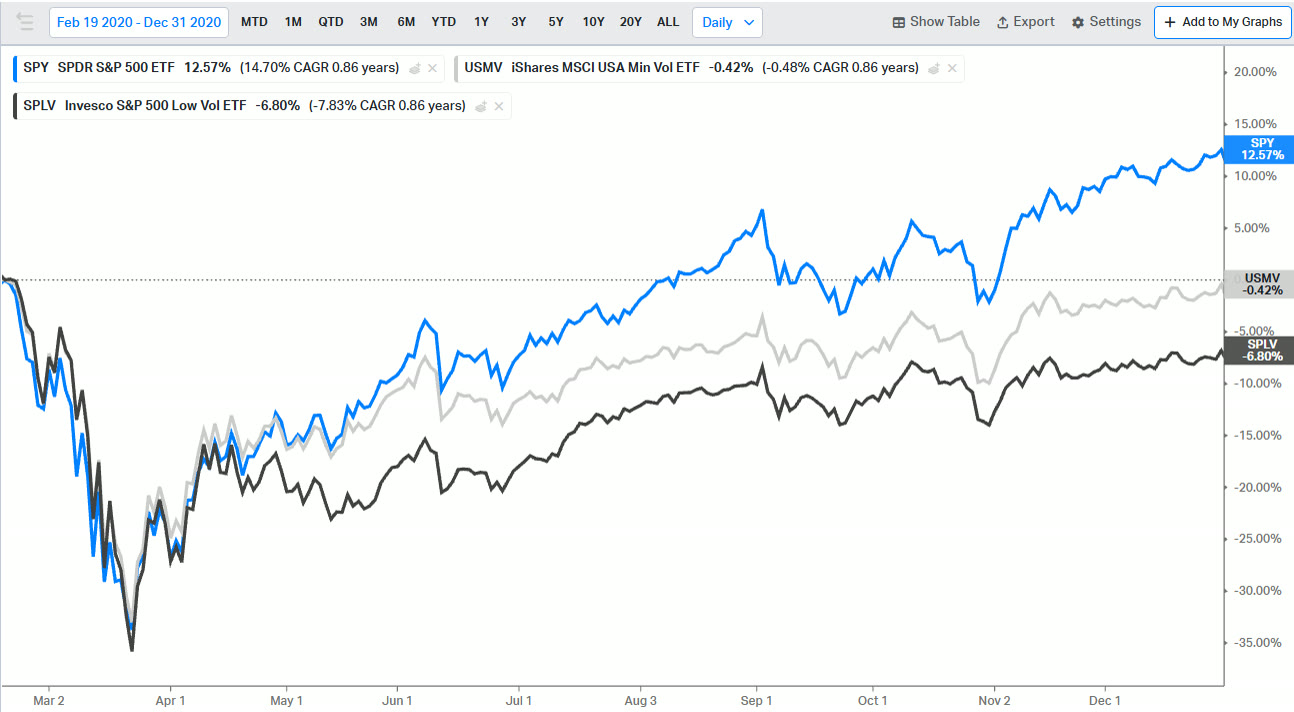
2020: no real protection on the way down.
2018
Back to normal. In late 2018, both min vol ETFs beat SPY in the downturn by a healthy margin, with SPLV slightly better, and then both trailed the market in the recovery.
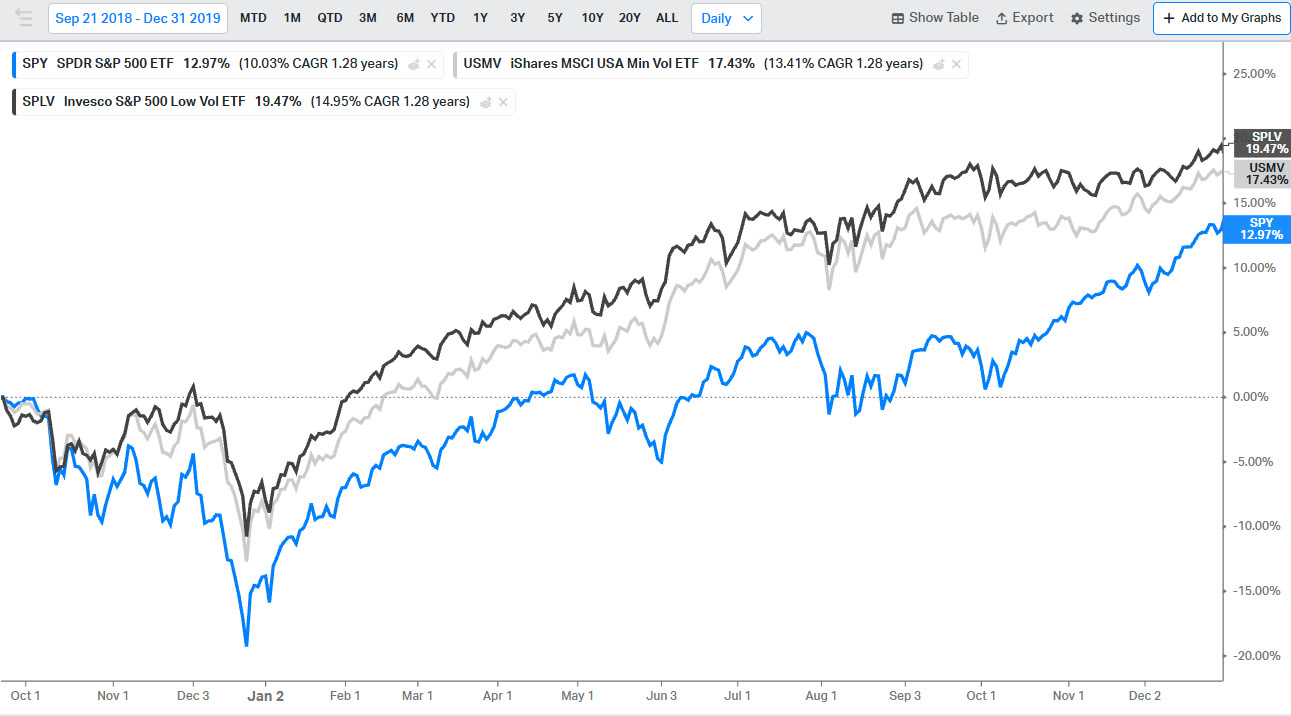
2018: better in the downturn, behind in the recovery.
2015–2016
Same thing: both beat the market in the first and second legs of the downturn, then lagged in the eventual recovery.
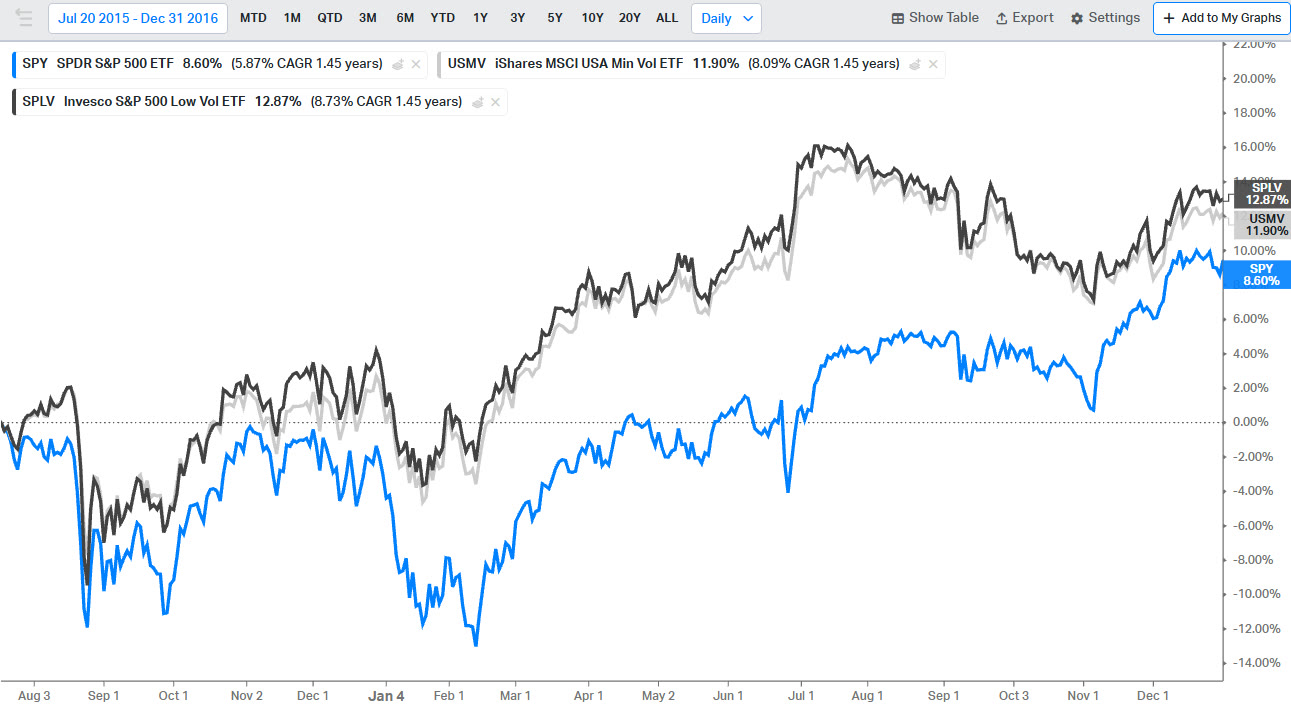
2015–2016: ahead in both legs of the downturn.
2011
USMV didn’t exist yet at the start of this downturn, but SPLV held up much better than the market on the way down and lagged on the way up, as usual.
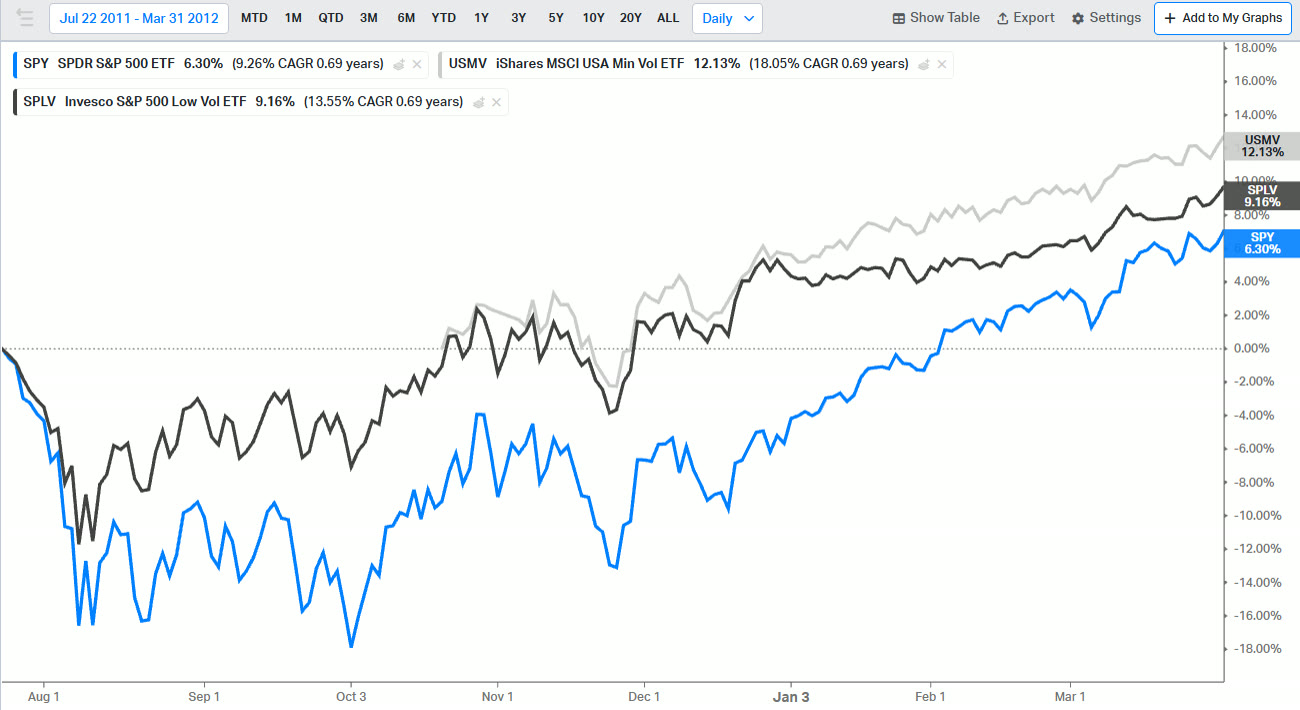
2011: SPLV held up much better on the way down.
So it’s pretty consistently what I expected: almost always better in downturns, and worse in recoveries.
The Long-Term Cost of Lower Volatility
Lagging on the upside has a price in the long run. After all, the market goes up far more often than it goes down. To be fair, the S&P 500 has compounded at more than 15% a year since USMV’s 2011 inception, which is definitely not normal, so I’d expect min vol funds to be closer in most 15-ish-year periods. But this is the general long-run pattern I’d expect: protection on the downside, with SPLV usually protecting better, and a lag on the upside and over time, with SPLV lagging a bit more.
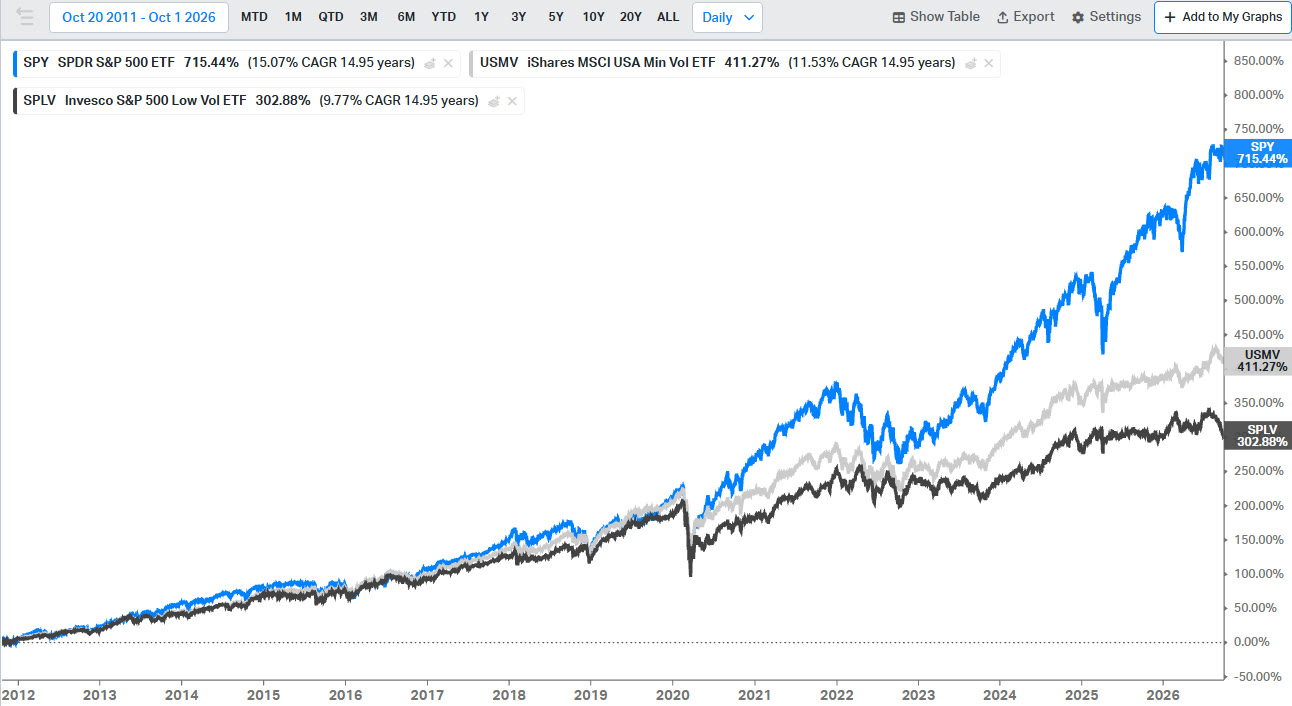
Since 2011: SPY (blue) far ahead of USMV (grey) and SPLV (black).
Better Ways to Lower Volatility?
The next part covers my top low volatility ETFs, along with alternative strategies that have delivered much better risk-adjusted returns — either much higher returns with only slightly more volatility than the min vol ETFs shown here…
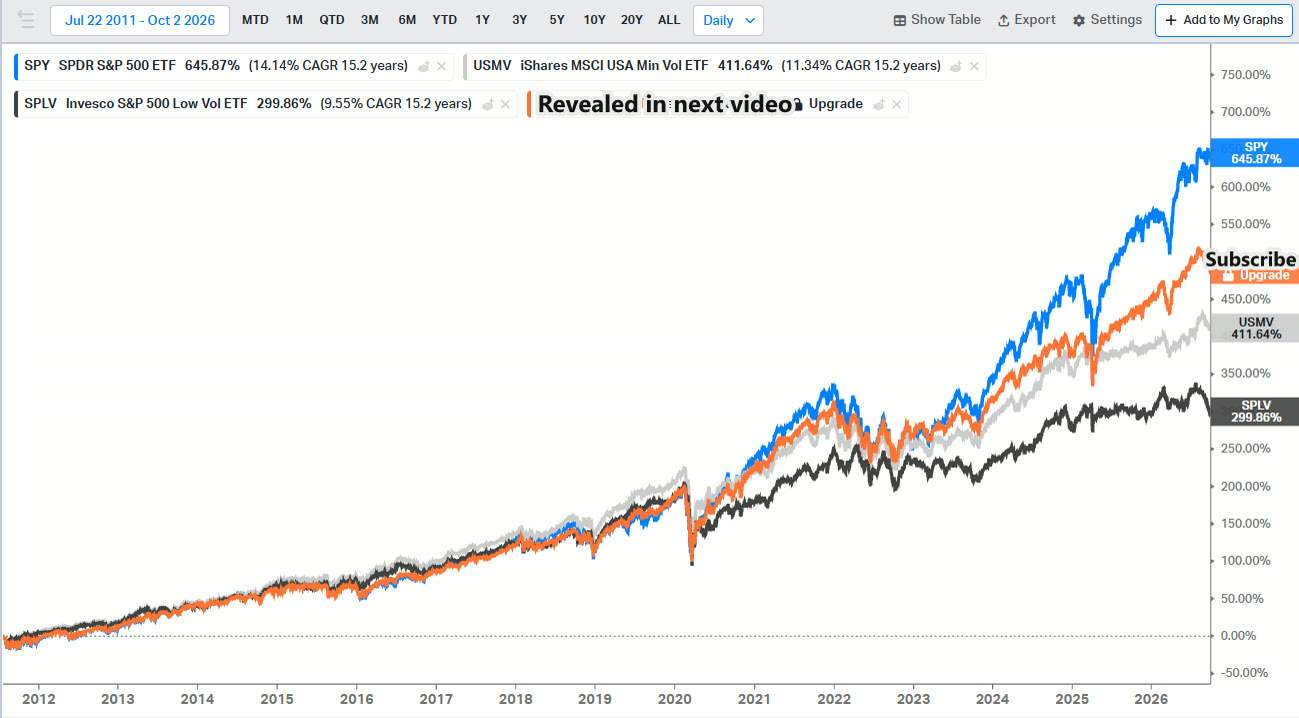
An alternative with much higher returns than the min vol ETFs (orange). Revealed in Part 11.
…or similar returns to the min vol ETFs with even better downside protection.
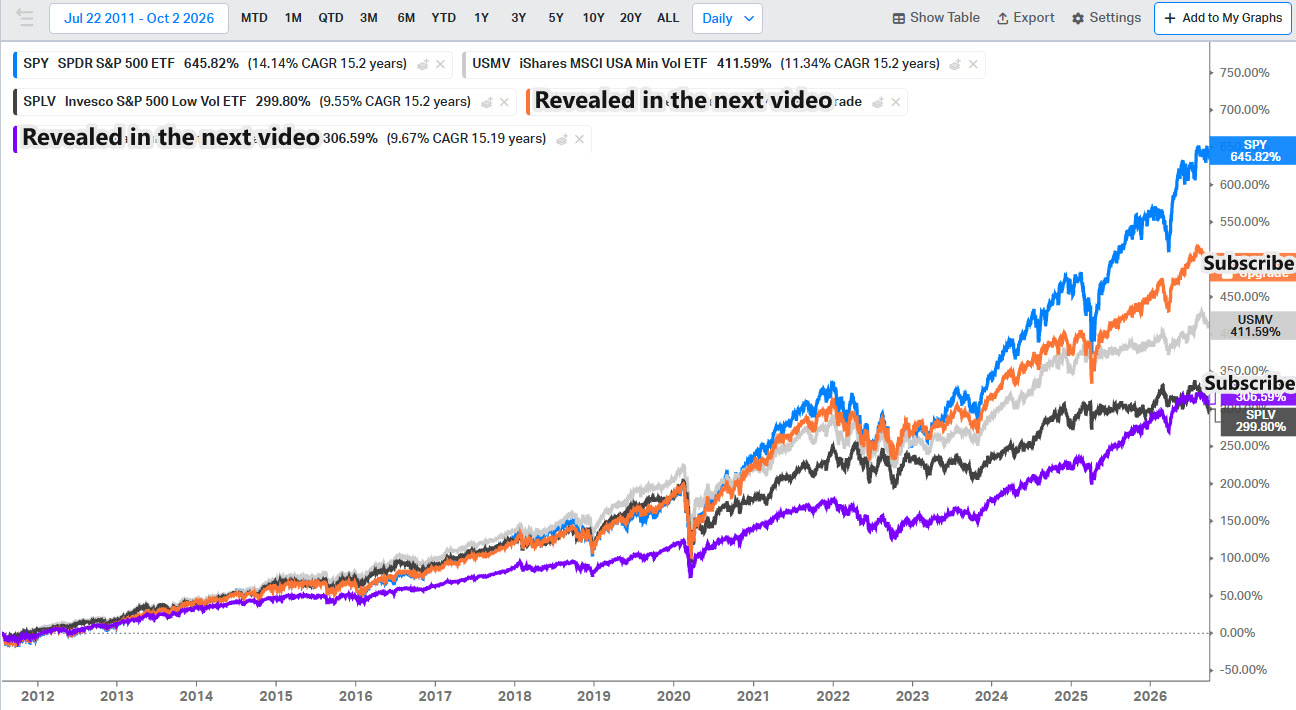
An alternative with similar returns and even better downside protection (purple). Revealed in Part 11.
Watch the Full Video
Want to Go Deeper? In the Fundamentals of Finance Academy, Ethan breaks down funds and current market events on a live call every other week, and members get the full archive of recorded calls. Learn more about the Academy →

This article is for educational purposes only and is not investment advice. Ethan is a CFA charterholder, but nothing here is a recommendation to buy or sell any security, and it does not take your personal situation into account. Past performance does not guarantee future results. Charts of index returns are for illustration only and don’t reflect the fees, expenses or taxes of any actual investment. Performance data and fund details are as of 10/07/2026 and will change; check each fund’s website for current figures.
