SPMO vs MTUM: Top Momentum ETFs Reviewed by a CFA Charterholder
MTUM, the iShares USA Momentum ETF, has absolutely crushed the S&P 500 over the past three years. But as big as the gap between MTUM and the S&P has been, there’s been an even bigger gap between MTUM and the second-largest momentum ETF, SPMO. In this part of our factor investing series, I’ll walk through why that is, and whether we can expect it to continue.
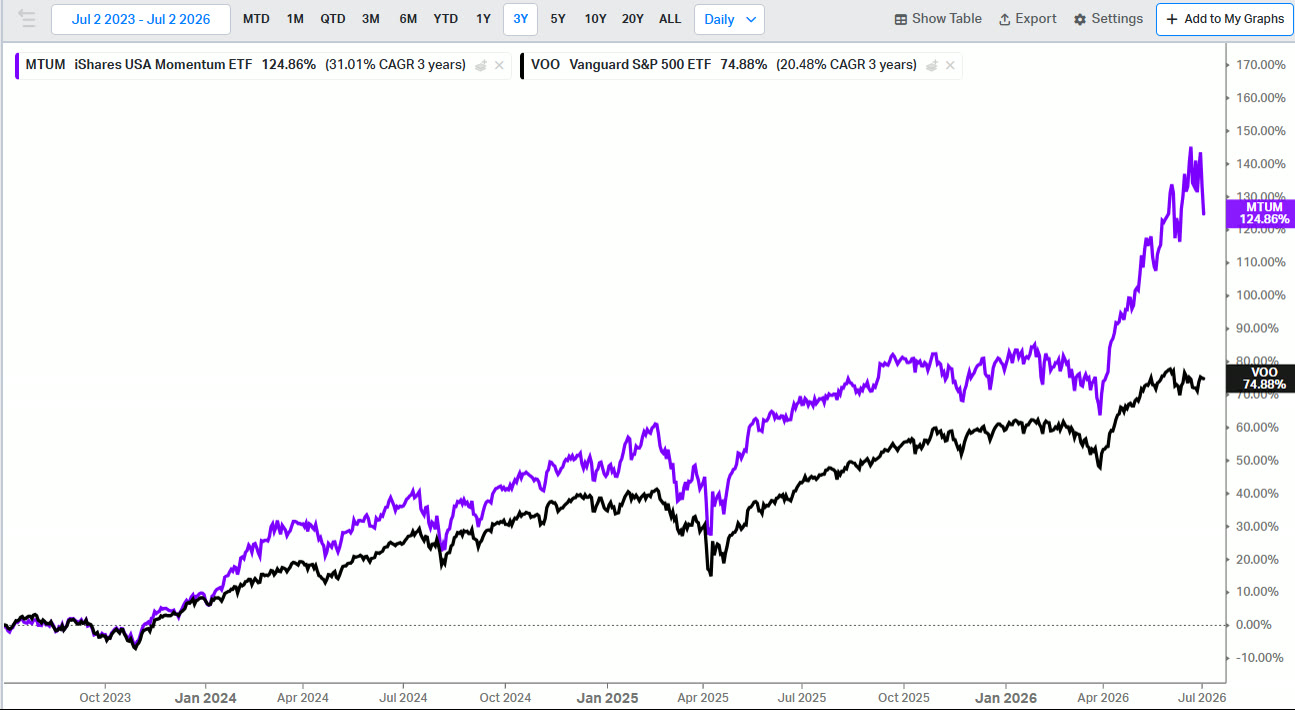
MTUM (purple) versus the S&P 500 (black) over the last three years.
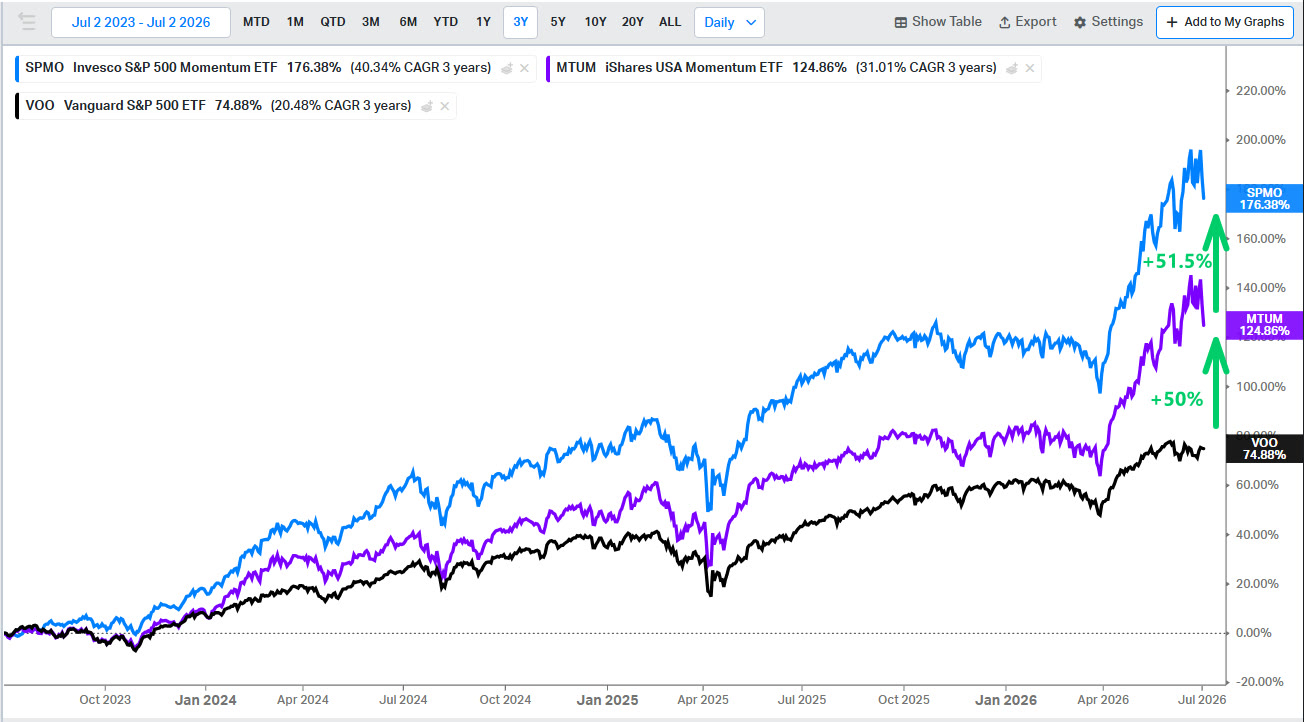
Add SPMO (blue) and the gap between the two momentum ETFs is even bigger than MTUM’s lead over the S&P.
The short version
SPMO and MTUM performed almost identically for years. Their split came from one period, late 2021 to mid-2025, and they’ve been roughly even again since July 2025.
They differ in four ways: the index they pick from, how they measure momentum, how often they rebalance, and their risk limits.
The biggest difference is concentration. SPMO has far fewer guardrails, which let it own much more of the Magnificent 7 during their run.
That cuts both ways: SPMO should lead when a few giant companies lead the market, and trail if they lead it down.
SPMO vs MTUM: a split that came from one period
Zoom out to 10 years and it really wasn’t this way for most of that time.
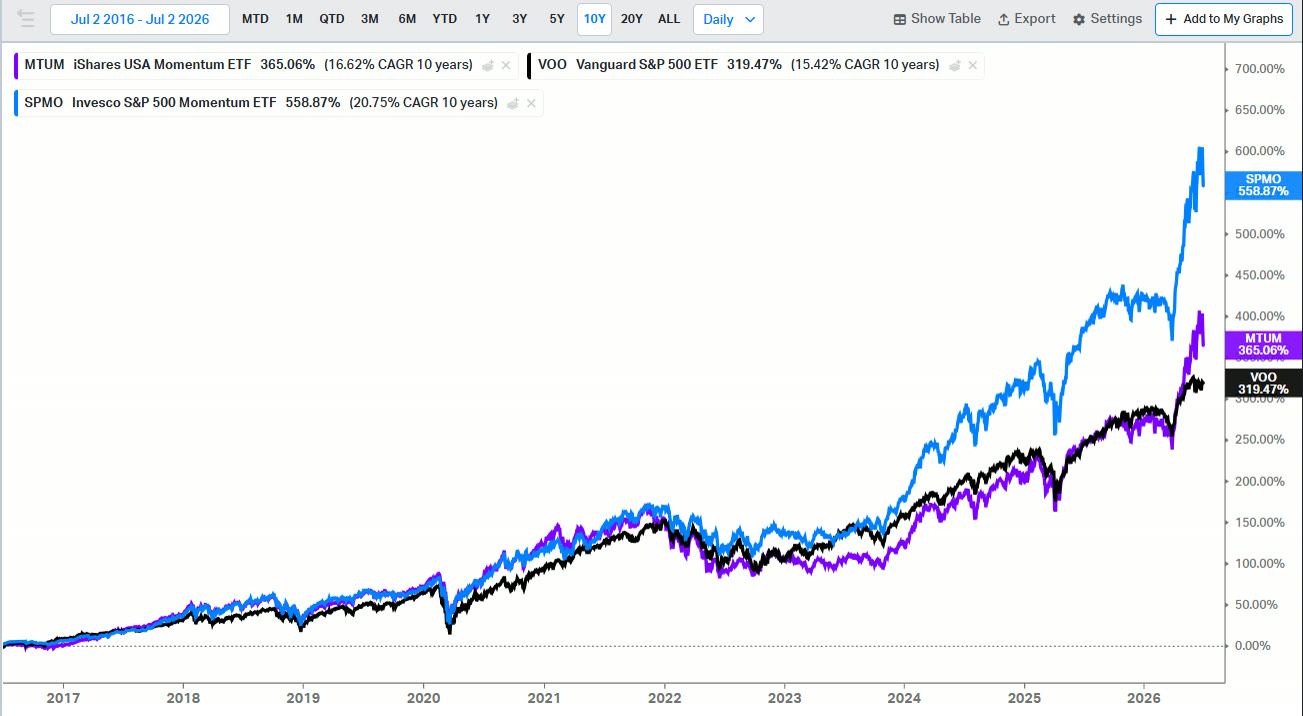
SPMO, MTUM and the S&P 500 over 10 years.
Both ETFs had nearly identical performance through late 2021: ahead of the S&P, but not by a crazy amount, a little over 2% a year for just over five years.
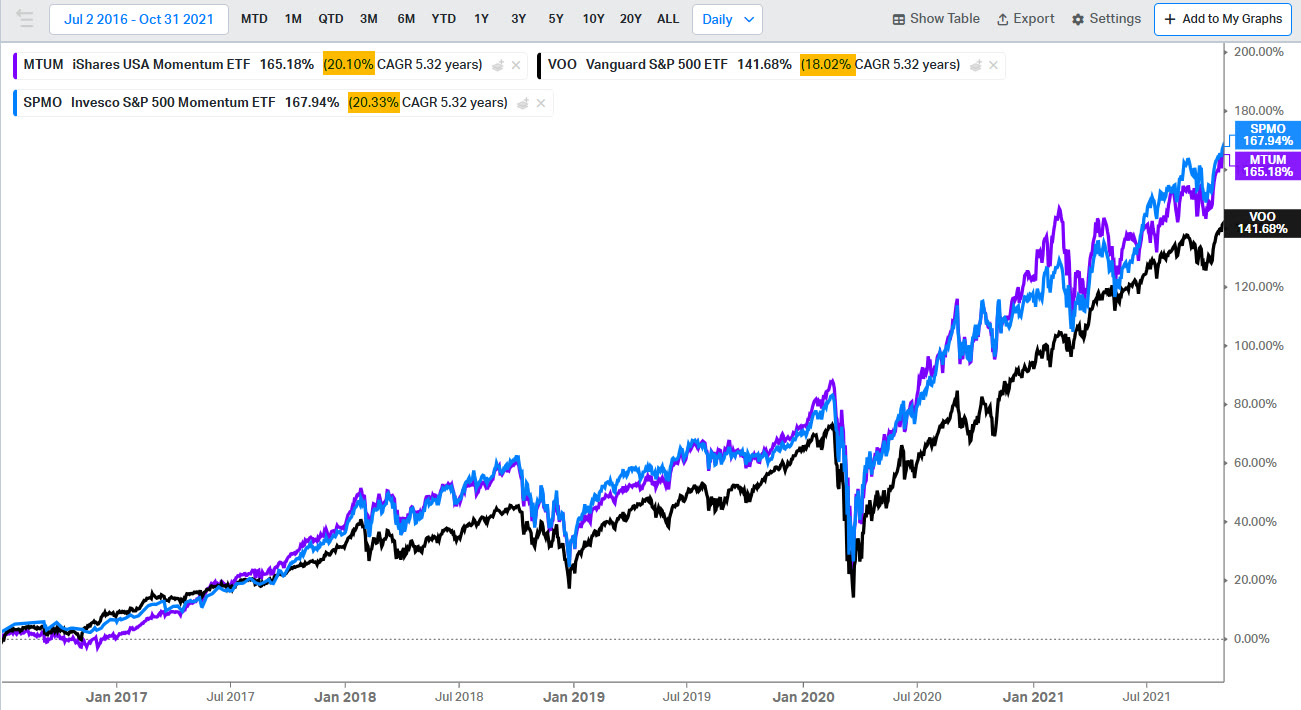
Through late 2021: nearly identical, both a little over 2% a year ahead of the S&P.
Then, over the next two years, momentum swung back and forth: tech went from leading to lagging to leading again, and the market went from amazing returns to a sell-off to a strong recovery. Both momentum ETFs trailed the market, but MTUM did way worse.
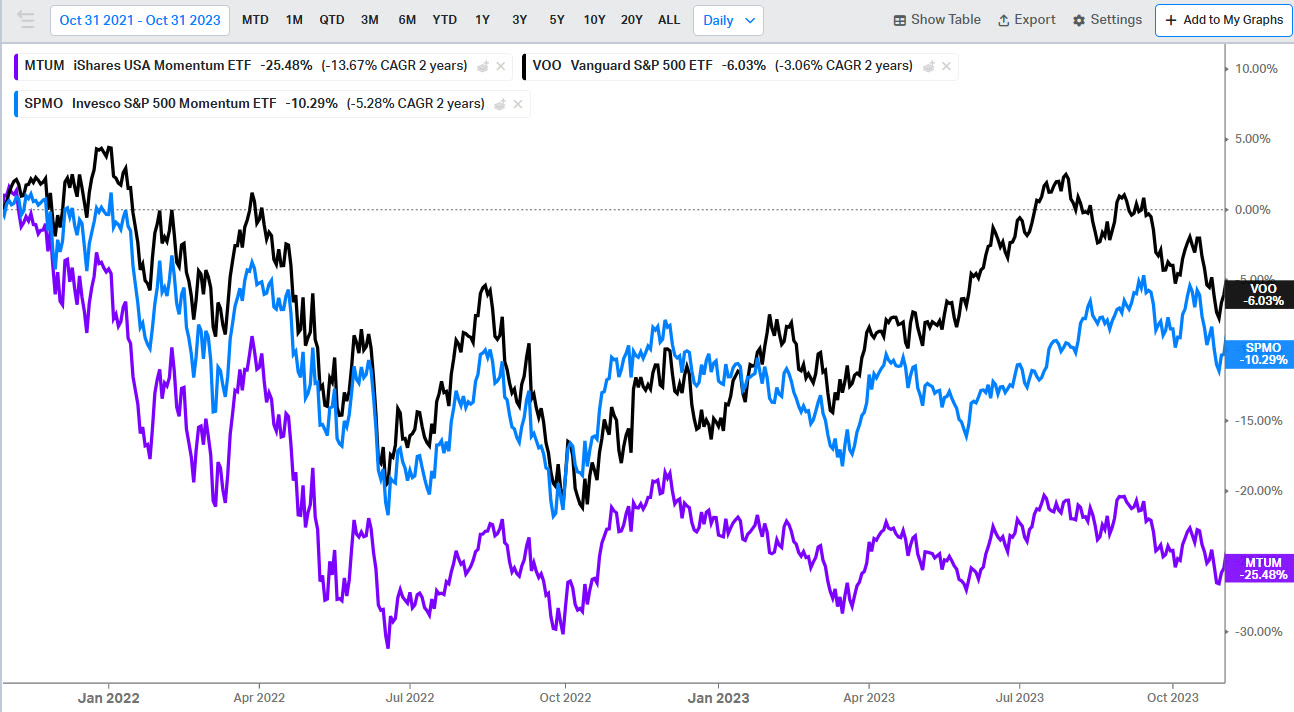
Late 2021 to 2023: both trailed the S&P, MTUM (purple) by much more.
Back on the 10-year chart, by mid-2023 the S&P had actually pulled back ahead of both. After beating it by over 2% a year for more than five years, they gave it all back in less than two. Then ChatGPT and the data center buildout brought a period of consistent, sustained leadership by one area — tech — and both momentum ETFs recovered beautifully, with a particularly strong spike in the last few months. This isn’t beating the market by 2% a year; it’s significantly more. And MTUM and SPMO also diverged from each other, massively. So what gives?
The four ways SPMO and MTUM differ
The funds differ in four key ways: the index they pull from, how they define momentum, how often they rebalance, and their risk limits. Let’s take each in turn and see what caused the divergence — and, more importantly, whether to expect it to continue.
1. The underlying index
MTUM picks the top momentum companies from the MSCI USA index (which the ETF PBUS tracks). SPMO picks them from the S&P 500 (which SPY tracks). The two indexes differ slightly, but they’re 94% the same by weight, so the underlying index is unlikely to explain the gap.
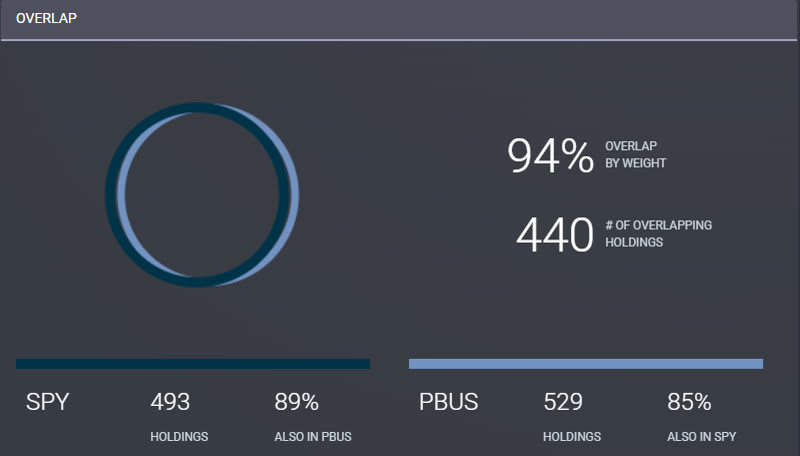
SPY and PBUS overlap by 94% by weight: the starting universes are nearly identical.
2. How they measure momentum
If the universes are pretty much the same, how about the way each fund decides what to buy?
SPMO buys the 20% of S&P 500 companies with the highest momentum over the past year, moved back by a month — from 13 months ago to 1 month ago. Skipping the latest month is meant to avoid the sharpest reversals that can come from buying right at a peak. That works out to about 100 stocks.
MTUM uses a combination of 6- and 12-month momentum scores instead of 12 months alone, and holds roughly 125 stocks.
Both are “risk-adjusted,” which basically means that if momentum is positive, lower volatility gives a stock a higher score; if momentum is negative, higher volatility does. Let me explain, and forgive my terrible art skills.

Two paths to the same place: the straight one (blue) has more momentum in that direction than the zig-zag (green).
Imagine two people running in the same direction, one running straight and the other zig-zagging, and they arrive at the same place. All else equal, which one has more forward momentum in that direction? The one that’s been going more consistently that way, right? A stock’s momentum score works the same way. Here, lower volatility does not mean a less risky company; it means one that’s been moving more consistently in the same direction over the measurement period. This could make a slightly bigger difference than the index, but I think the last two differences mattered more.
3. How often they rebalance
SPMO rebalances twice a year. MTUM rebalances quarterly, with a cap of 30% on how much of the fund can change at each rebalance. That matters because in sustained rallies (or declines) led by one area of the market, SPMO holds on to its stocks twice as long without changes. Letting winners run can boost returns in sustained one-way markets led by the same area, which is what we’ve had for most of the last few years. It can also work the other way in a sustained downturn, though the market tends to have far more sustained bull markets than bear markets.
4. Risk limits: the biggest difference
In short, MTUM has way more risk controls to avoid over-concentration. On top of holding more stocks and limiting turnover, it caps each company at 5% of the fund, or sometimes lower depending on more detailed criteria. SPMO caps each company at 9% or three times its weight in the index, whichever is lower, and has essentially no other diversification requirements that I could find.
That’s how you get similar holdings in each, but far more concentration at the top in SPMO: 37% in the top five holdings (counting both share classes of Alphabet) versus 25% in MTUM.
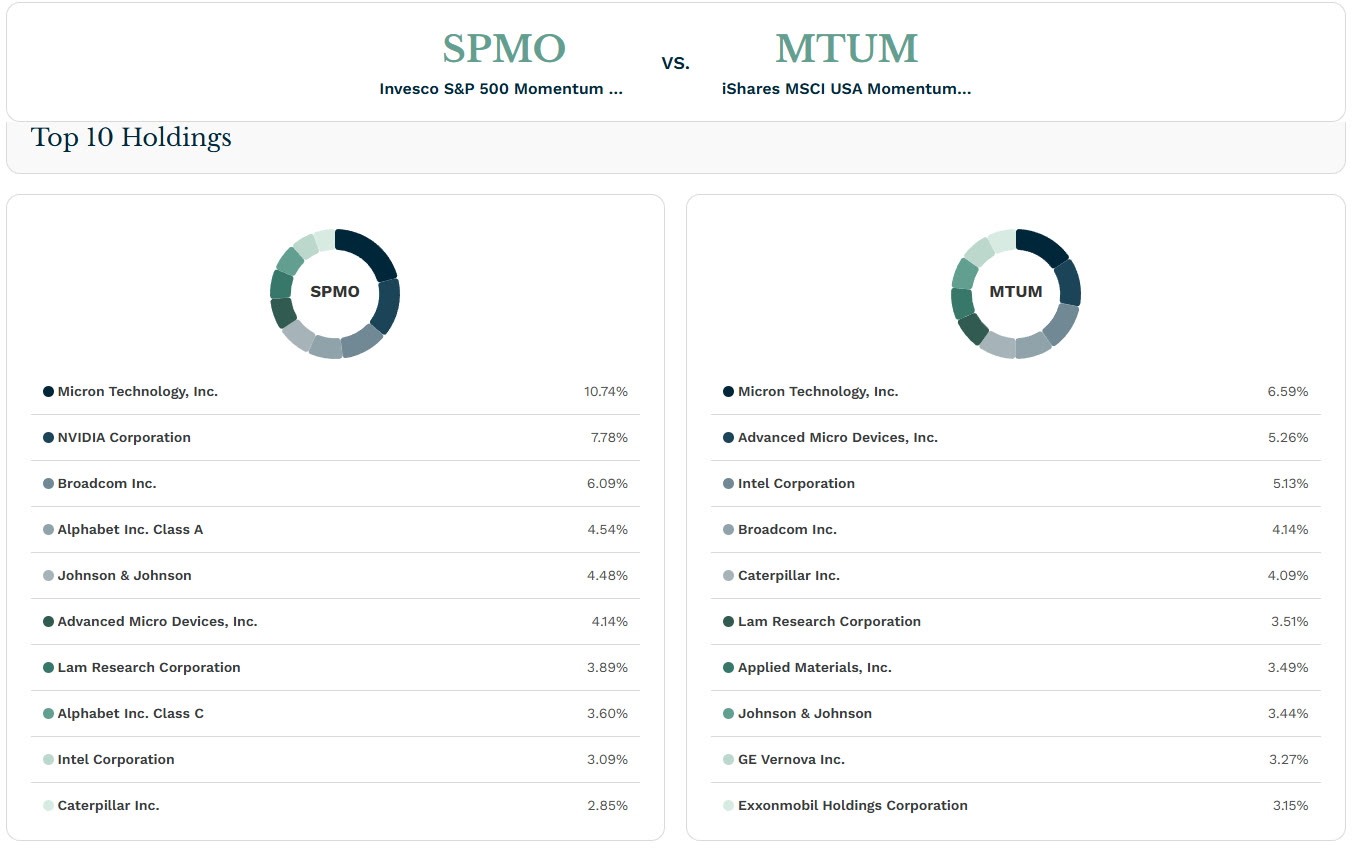
Similar names, very different weights: SPMO is much more concentrated at the top.
SPMO also has an even bigger emphasis on tech. Generally, it can — and often does — get more concentrated than MTUM because of fewer holdings (100 versus about 125), the ability to own more of each company (9% versus 5%, with a few stipulations for each), and less frequent rebalancing, which lets winners grow further beyond those limits during strong rallies.
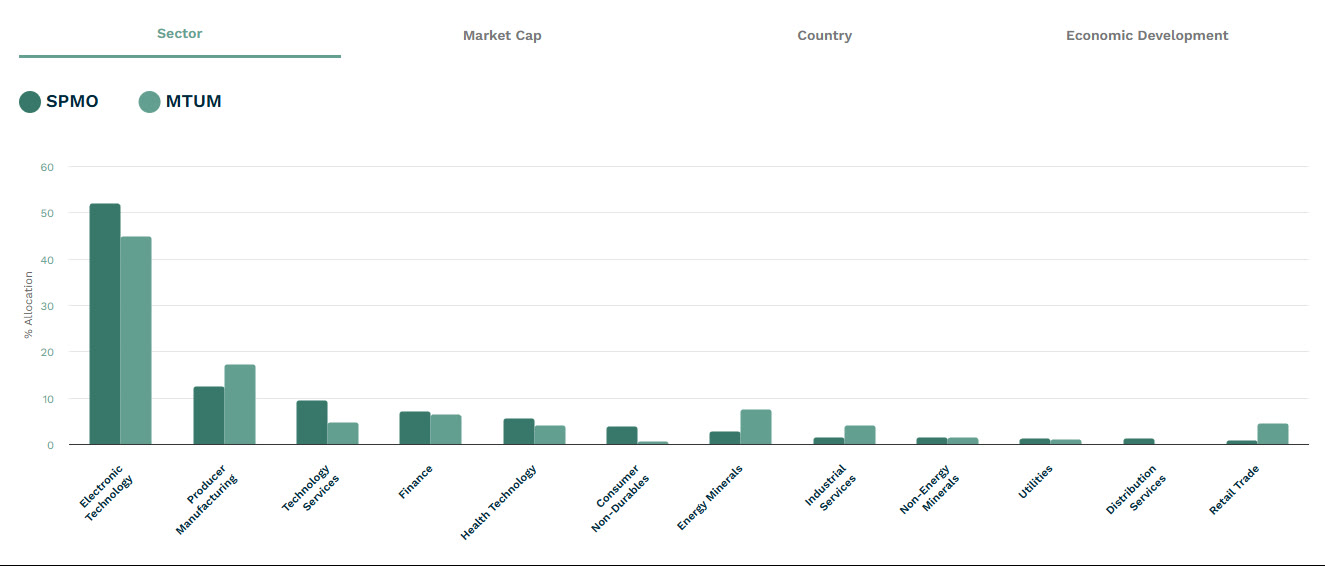
Sector weights: SPMO leans even harder into tech than MTUM.
Was SPMO’s outperformance a one-off?
What looks like persistent outperformance for SPMO on a long-term chart, or in standard trailing returns, was really an isolated event. From 10 years ago through late 2021, SPMO and MTUM were pretty much even. And since late July 2025 — almost a year now — they’ve been pretty much even too.
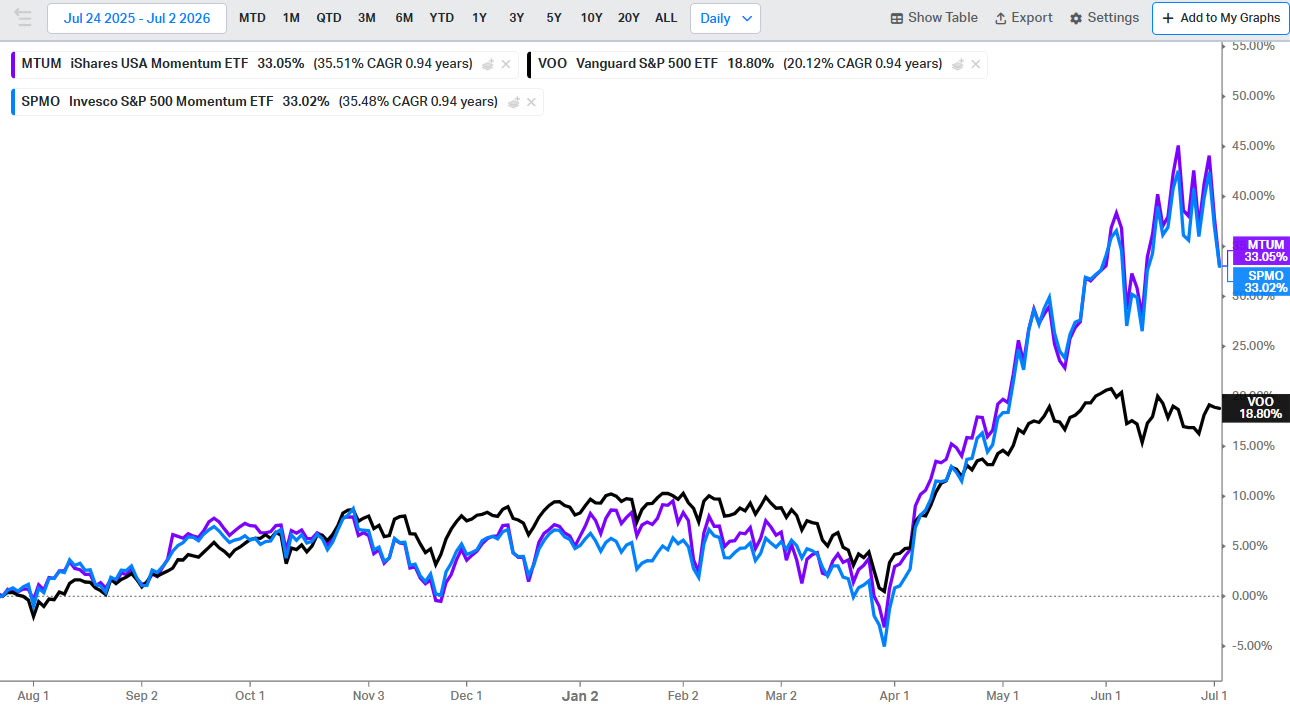
Since late July 2025: roughly even again.
So it was really the period from late 2021 to mid-2025 when SPMO somehow crushed the S&P 500 while MTUM got crushed by the S&P 500. That’s a pattern I’d expect to almost never see.
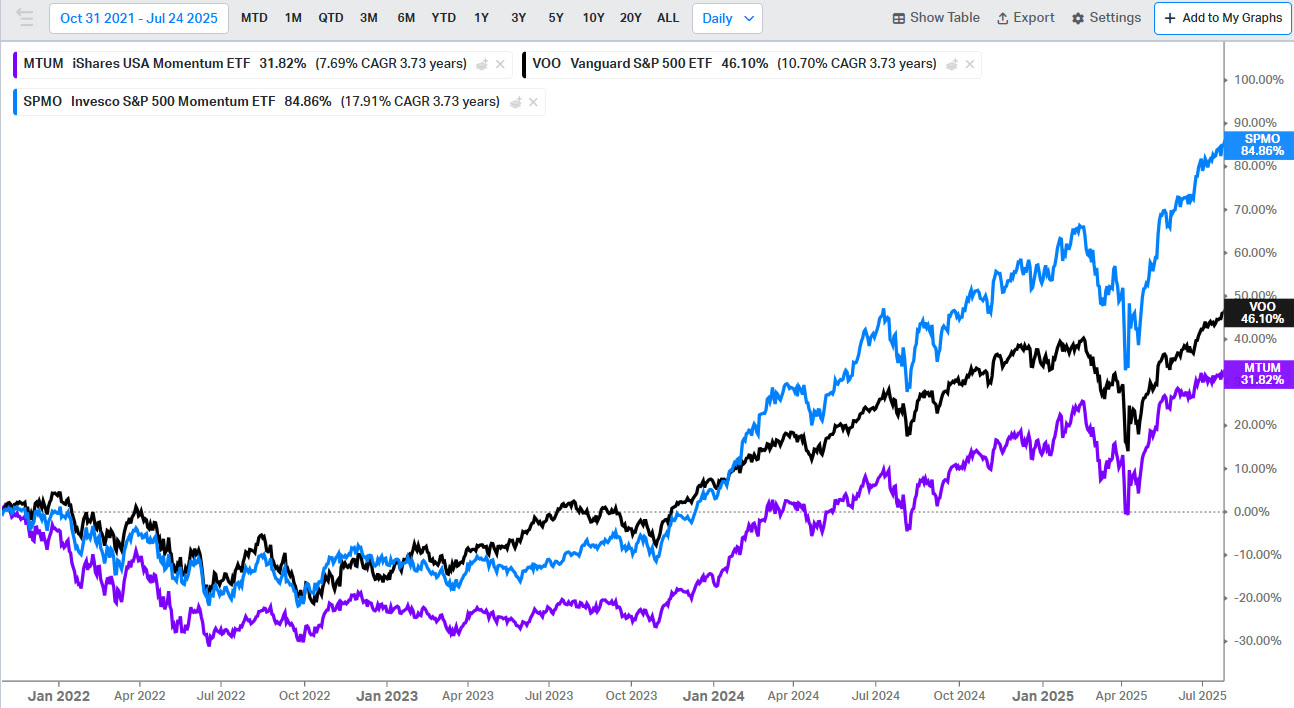
Late 2021 to mid-2025: SPMO (blue) far ahead of the S&P (black), MTUM (purple) far behind.
For the record, I pulled in a couple of smaller momentum ETFs to see where they stood, and SPMO is clearly the outlier. But the bigger message is that it just isn’t that predictable. Look only at the end result and Vanguard’s VFMO (orange) and MTUM finished pretty much even, but you’d miss that VFMO was way ahead most of the time because it did better in the 2022 downturn, then did far worse in the 2025 downturn and fell back to even. Fidelity’s FDMO keeps its sector exposure neutral to the market, and VFMO limits each company to 1.5%. In my opinion it really comes down to concentration and risk limits. SPMO has fewer of them than other momentum ETFs, and in good times for momentum, being more momentum-y is great. It can also work the other way.
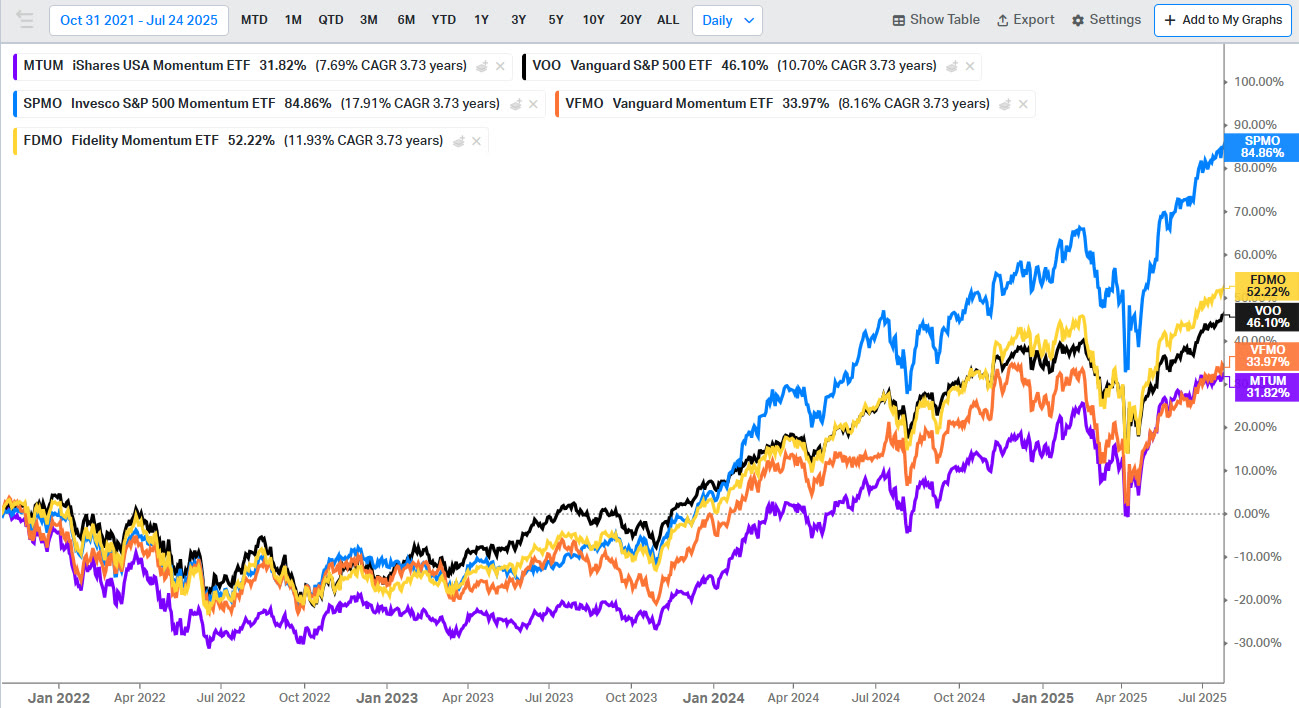
SPMO, MTUM, VFMO (orange) and FDMO (yellow) since 2022: SPMO is the clear outlier.
The Magnificent 7 effect
I think you can chalk a lot of it up to the dominance of the Magnificent 7. Since ChatGPT launched, the top few companies have dominated the market, and SPMO’s lack of sector limits and looser company limits let it own a lot more of them.
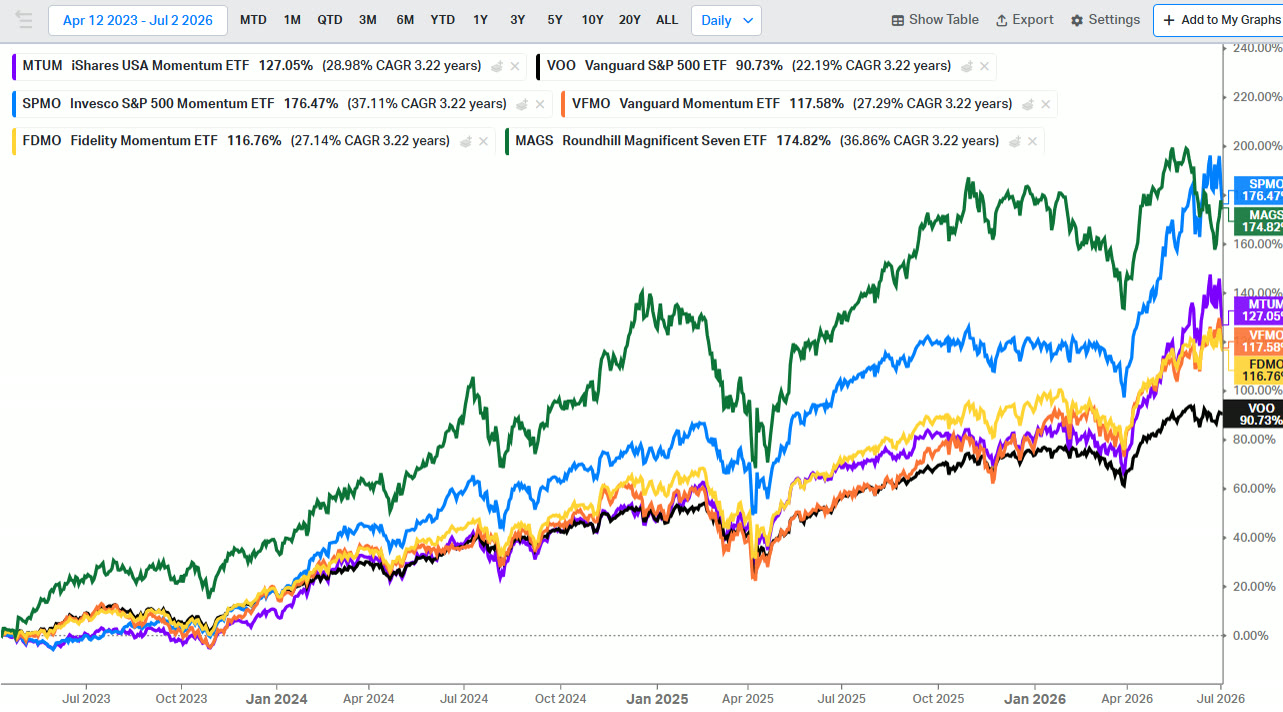
Since 2023, with the Magnificent 7 (MAGS, green) added.
Since last July, when SPMO and MTUM have been about even, the Mag 7 has trailed the S&P 500. I don’t think that’s a coincidence.
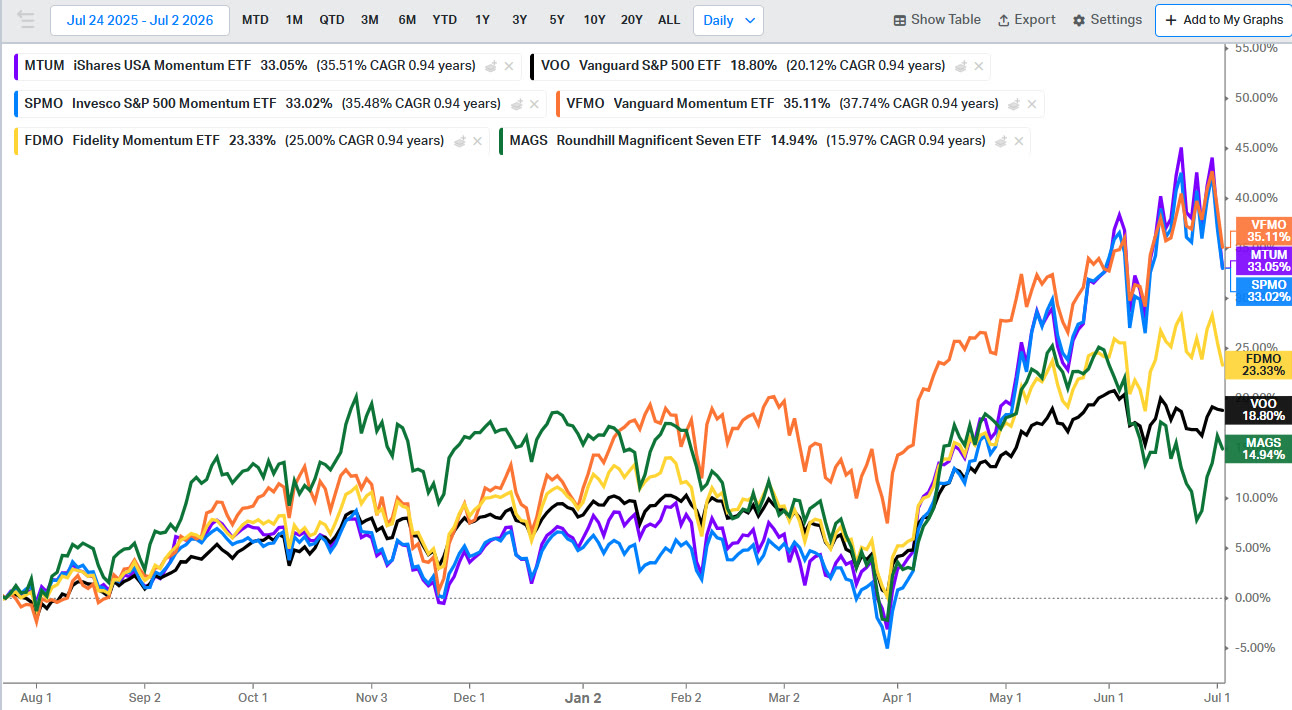
Since July 2025: the Mag 7 (green) has trailed, and SPMO’s edge has disappeared.
Here were the top holdings in February 2024, at the height of that run.
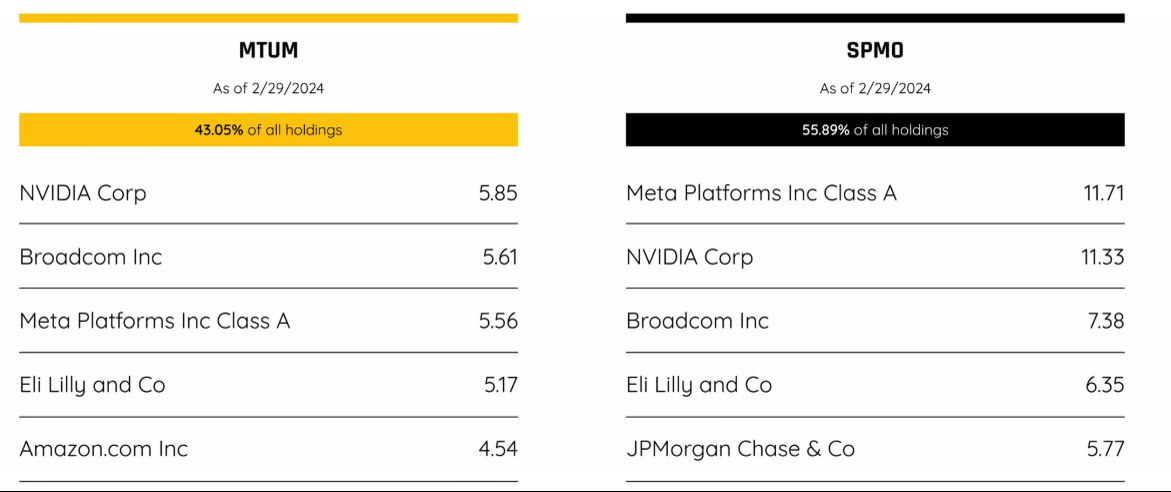
February 2024: SPMO held 55% in its top holdings versus 43% for MTUM, with Meta and NVIDIA each above 11%.
What it means going forward
I see absolutely no reason to believe SPMO will consistently outpace other momentum ETFs. If the market keeps being led by the same few companies producing the strongest results, SPMO is likely to beat the rest of the market. But if there’s a downturn led by those same few companies, it’s likely to trail. If AI turns out to be a bubble and it bursts, I wouldn’t want to hold SPMO in that environment.
But we don’t know what will happen, and in the end these are all just opinions. So the better question for an investor is about style: a purer momentum strategy that really goes for it, like SPMO, with the extra risk and return potential that comes with it — or a tilt toward the momentum factor with more guardrails, like MTUM or one of the other momentum ETFs.
Next in the series: a deep dive into the factor I think is due for a resurgence over the next decade.
Watch the full video
Want to go deeper? In the Fundamentals of Finance Academy, Ethan breaks down funds and current market events on a live call every other week, and members get the full archive of recorded calls. Learn more about the Academy →

This article is for educational purposes only and is not investment advice. Ethan is a CFA charterholder, but nothing here is a recommendation to buy or sell any security, and it does not take your personal situation into account. Past performance does not guarantee future results. Performance data and fund details are as of July 2026 and will change; check each fund’s website for current figures.
