Quality Factor Investing Explained: How to Measure High vs. Low Quality ETFs
About this article: This article is based on Ethan’s video, originally published on September 1, 2026. Because the written version was published later, returns, yields and fund details reflect data available at the time of the video and have likely changed since. Please check each fund’s website for current figures.
Factor Investing Series: you’re reading Part 7 of 11
Part 1: Momentum Investing Explained
Part 2: SPMO vs MTUM
Part 3: Small-Cap Investing Explained
Part 4: Top Small-Cap ETFs
Part 5: Value vs Growth Stocks
Part 6: Best Value ETFs
Part 7: Quality Factor Investing Explained (you’re here)
Part 8: Top International Quality ETFs
Part 9: Top U.S. Quality ETFs
Part 10: Minimum Volatility Investing Explained
Part 11: Best Low Volatility ETFs
You buy something online, it’s great at first, and then it stops working, because you didn’t realize it wasn’t good quality. We’ve all been there. The same thing happens with investments. People often don’t realize they’ve bought funds packed with low-quality companies, and those often work out for a while, but generally not in the long run. Right now, low-quality companies could be near their breaking point.
So what’s the difference between high- and low-quality companies, how can you tell whether a fund you own leans low quality, and why might low quality be about to break? That’s this part of our factor investing series, which so far has covered momentum, small caps and value, plus the top ETFs for each.
The Short Version
Quality means reliability: a healthy balance sheet, historically strong and stable profits, and the potential to sustain them.
You can check any fund’s quality tilt for free on Morningstar’s factor profile.
Quality ETFs tracked the market closely for years, but have lagged sharply since the April 2025 “Liberation Day” bottom.
That pattern, lagging in euphoric recoveries and leading once the euphoria fades, also showed up in 2009–2011 and 2020–2022.
What Does “Quality” Mean in Investing?
At its most basic level, quality in investing means pretty much what it means everywhere else in life. As with most factors, everyone defines it a bit differently, but it’s generally measured by looking at the characteristics of companies that lead to reliability over time.
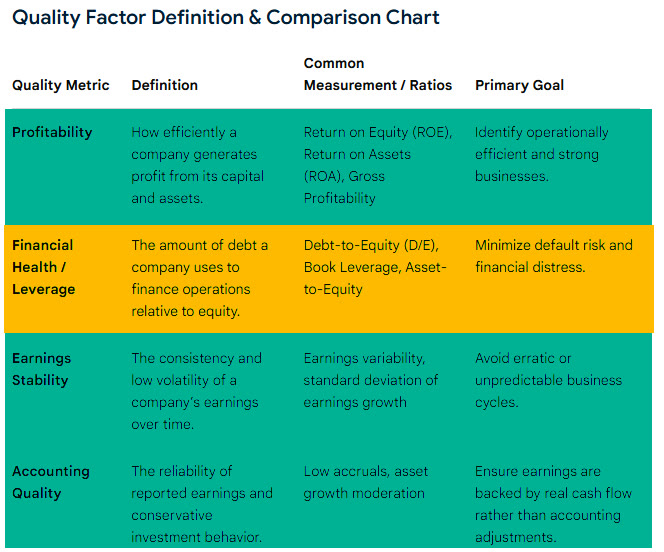
The building blocks of quality: balance sheet health (yellow) and earnings quality (green).
Balance Sheet Health
On the balance sheet side, quality looks at things like debt-to-equity and the interest coverage ratio to judge how vulnerable a company is if something goes wrong. Imagine a friend with a nice car, a nice house, everything apparently going well, but who’s actually hanging on by a thread, and if one thing goes wrong they can’t pay their debts.
Companies work the same way. Earnings growth can be great and the valuation attractive, but if a company is leveraged to the max and needs to refinance its debt next year, it may not be able to if there’s a recession, its earnings fall and the bond market dries up. A similar company with less debt would have an easier time getting through that, because lenders would be more willing to lend to it.
Profitability and Earnings Stability
On the earnings side, it starts with profitability metrics like return on equity (ROE) and return on assets (ROA). These are table stakes for any quality assessment; low profitability clearly means a company is less reliable in the long run.
But being profitable today isn’t enough; the next question is how likely a company is to stay profitable. Does it have a strong industry position and pricing power that can carry it through a recession — like Boeing and Airbus, with their near-duopoly in commercial planes and nearly a decade-long order backlog? Or is it a cyclical company that’s very profitable in good times but can quickly swing the other way?
Take Microsoft, the largest holding in QUAL, the iShares MSCI USA Quality Factor ETF. Look how consistent its earnings are. There have been a few short dips, but it hasn’t lost money in over a decade, and it has grown pretty consistently.
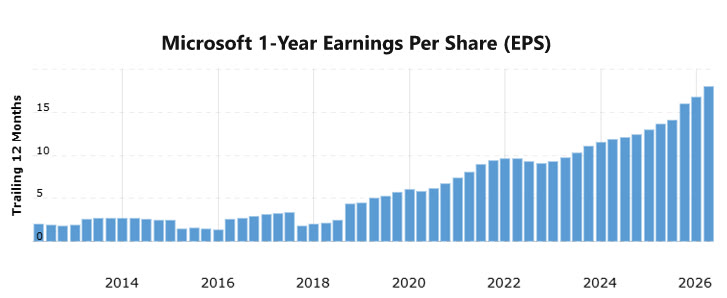
Microsoft’s earnings per share: steady and rising.
Contrast that with Vale, a Brazilian iron ore miner. I’m not saying it’s an unattractive company, or even less attractive than Microsoft. But its earnings are far less reliable: its fortunes are tied to iron ore and other metal prices, and it’s exposed to natural disasters, Brazilian politics and the Chinese real estate market. Its business is far more boom-and-bust than collecting recurring subscription revenue and hosting websites in the cloud.
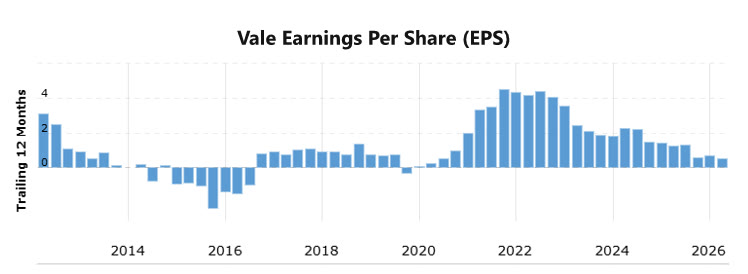
Vale’s earnings per share: boom and bust.
Accounting Quality
The last row is harder to capture in a simple metric like ROE, ROA, EPS growth or interest coverage, but active managers looking for quality definitely consider it. It’s often about spotting accounting tricks that create the illusion of steady earnings. One example: rising earnings alongside falling cash flows, which can be a sign the earnings aren’t real or sustainable.
Because these are hard to screen for, quality has generally worked better as a component of actively managed funds, where managers can use judgment, than as a purely quantitative screen. A lot of the most successful quality-oriented funds also combine it with other factors, like quality growth or quality dividend payers, and firms like Dimensional use quality alongside value and small caps in many of their funds.
How to Check If Your Fund Is High Quality
The simplest way to see whether a fund you own leans high quality: go to Morningstar.com, search for its name or ticker, open the Portfolio tab and scroll down to the five-year factor profile. If the quality bar has been consistently high, the fund has consistently leaned toward high-quality companies.
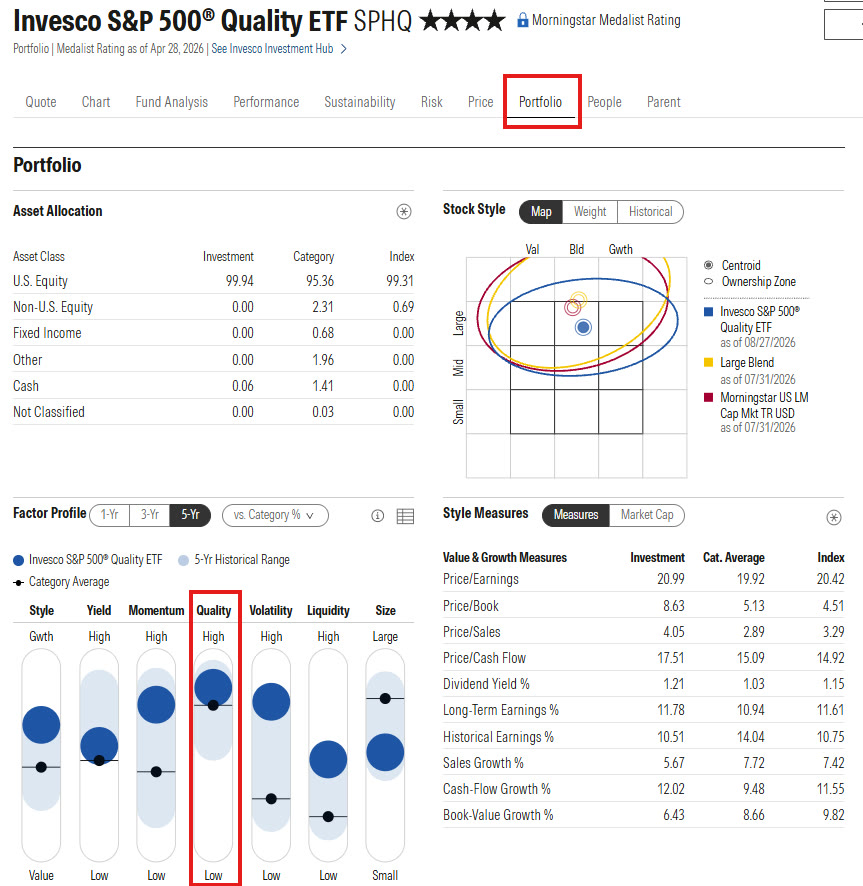
Morningstar’s factor profile (Portfolio tab) shows a fund’s quality tilt; here, SPHQ.
How Quality ETFs Have Performed
Since this part is specifically about quality, let’s look at the return profile of quality-oriented funds, using some admittedly imperfect quality ETFs as a guide. Here’s QUAL against PBUS, the Invesco MSCI USA ETF. I stopped the chart at the market bottom after Liberation Day in April 2025 (you’ll see why in a moment). From PBUS’s inception up to that point, performance was almost identical.
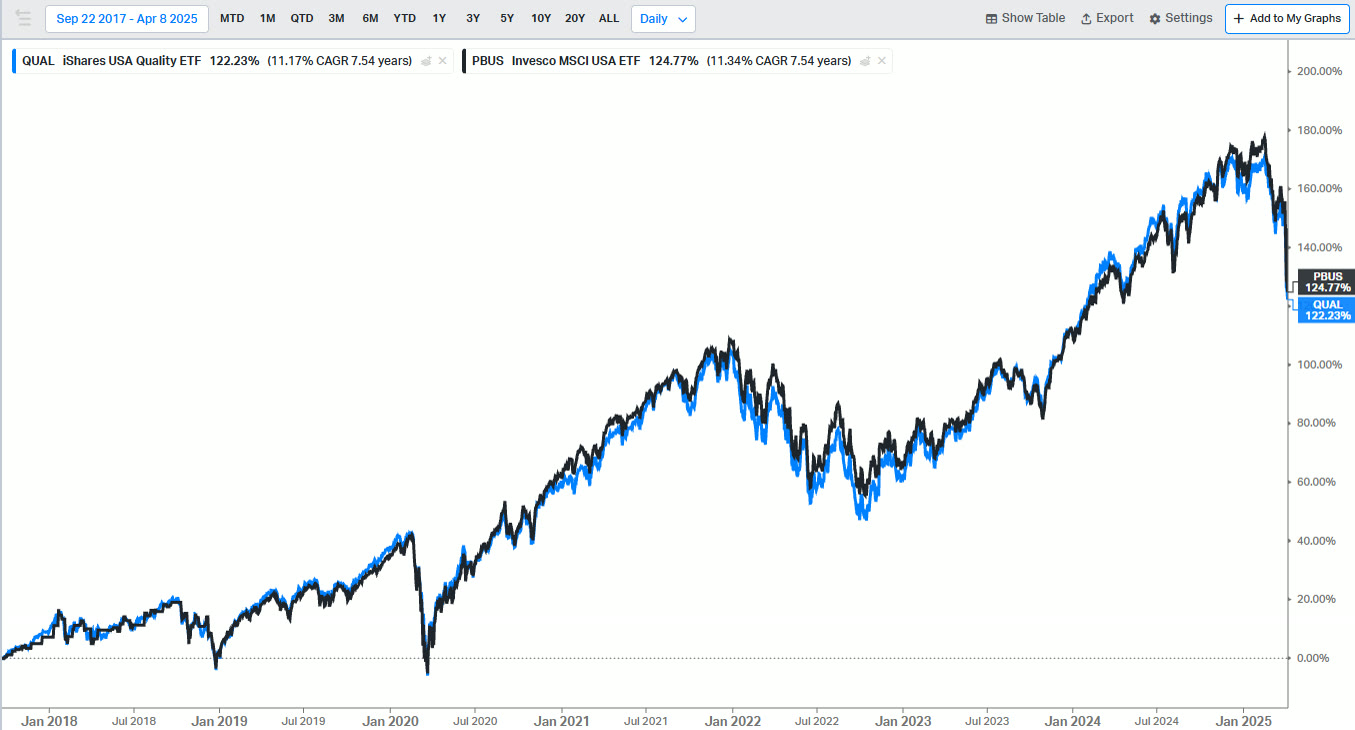
QUAL (blue) versus the broad MSCI USA (black) through the April 2025 bottom: nearly identical.
In theory, high-quality companies should have less downside risk, but that hasn’t always been the case; sometimes one line goes lower, sometimes the other. Either way, they’re usually similar, and the long-term results were similar too — until recently. Since Liberation Day, quality companies have significantly lagged the broader market in a way that has rarely happened before.
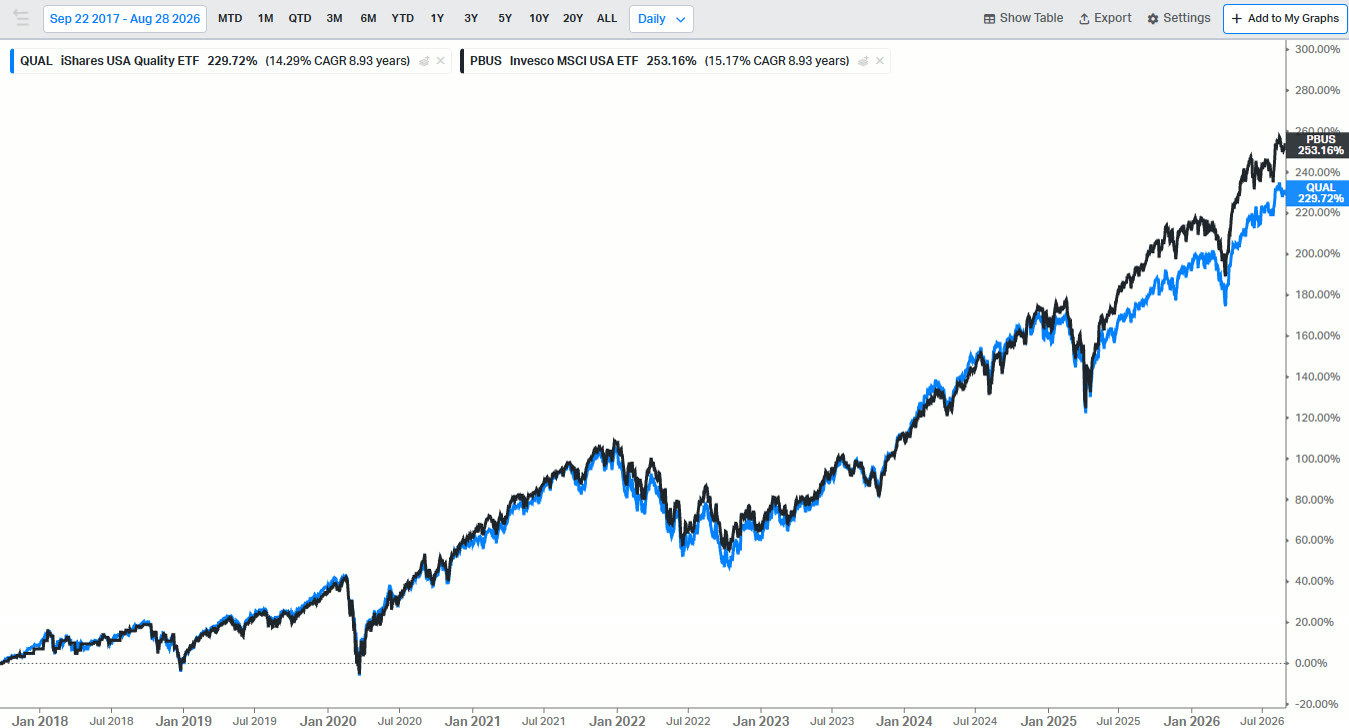
Since Liberation Day, QUAL (blue) has fallen well behind.
The same is true for another version based on high-quality S&P 500 companies, SPHQ, versus SPY. From 20 years ago through Liberation Day, SPY was ahead by just 0.14% a year — basically the difference in fees — but high-quality companies have massively lagged since.
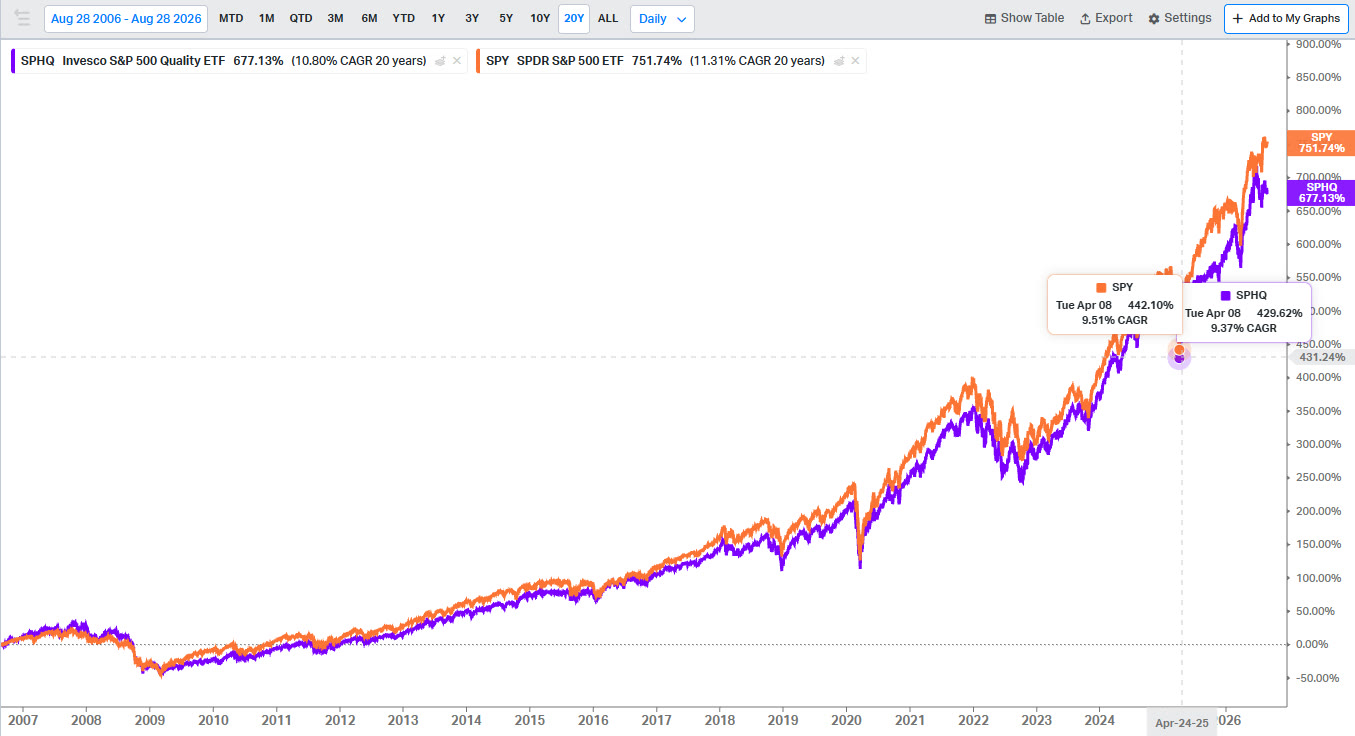
SPHQ versus SPY over 20 years: neck and neck until April 2025.
Why Have Quality ETFs Lagged?
It’s hard to say exactly, because quality ETFs measure quality very differently and use different rules to stay close to their benchmarks:
QUAL is market-cap weighted with a quality overlay, so its top holdings don’t look very different from the S&P 500’s.
SPHQ also considers market cap, but caps each holding at 5%, so its holdings look a bit different on the surface. Its sector weights end up similar, though, with almost 40% in tech, the ETF’s limit.
JQUA, from JPMorgan, hugs the index’s sector weights with stricter limits on company size, and has actually beaten SPY since its 2017 inception.
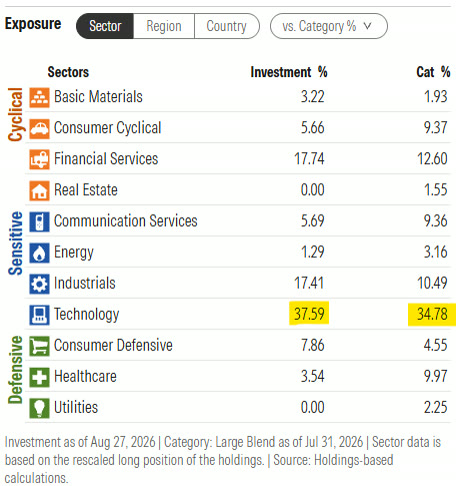
SPHQ’s sector weights: close to 40% in tech, its limit.
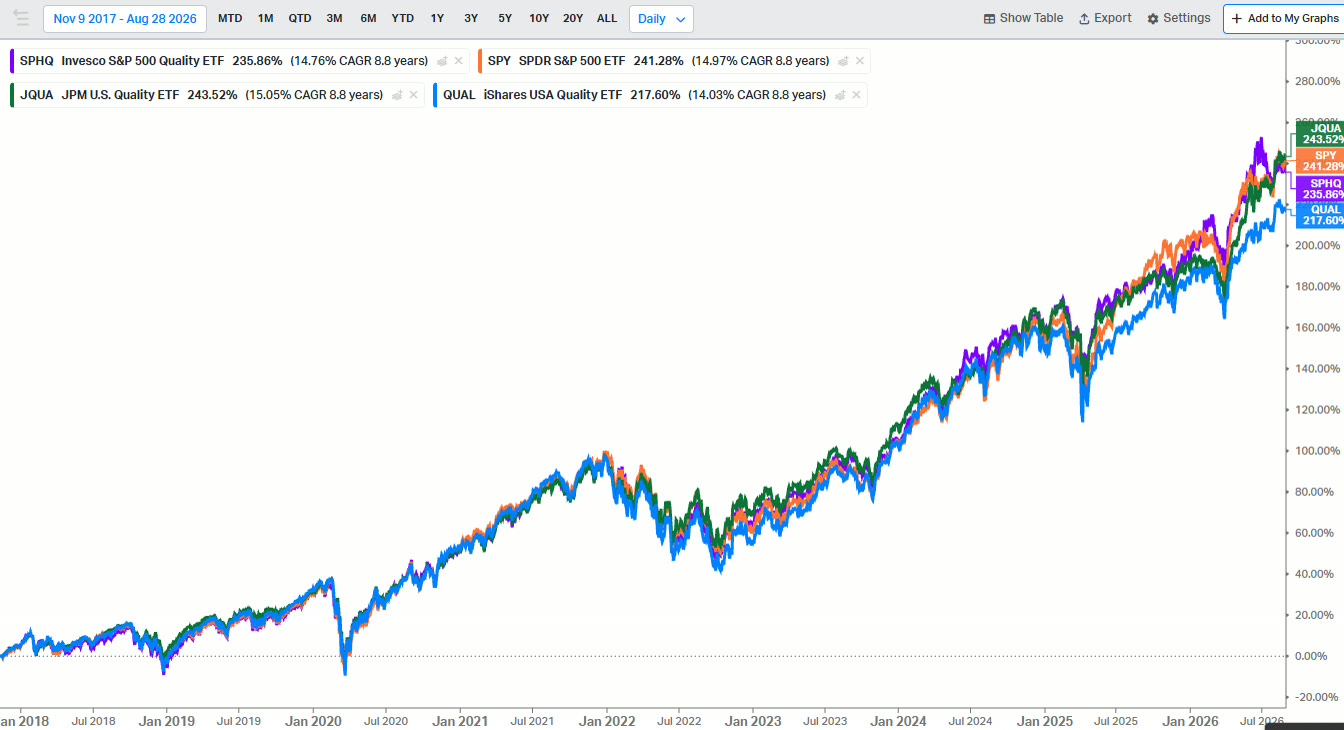
Since 2017: JQUA (green) has beaten SPY.
But JQUA has lagged since Liberation Day too. If you ask me, it’s largely because we’ve been in a major risk-on market where nobody has been remotely worried about a downturn. Some of the most indebted companies — which these ETFs generally avoid, like those levering up to get into the data center game — have also had the highest recent returns.
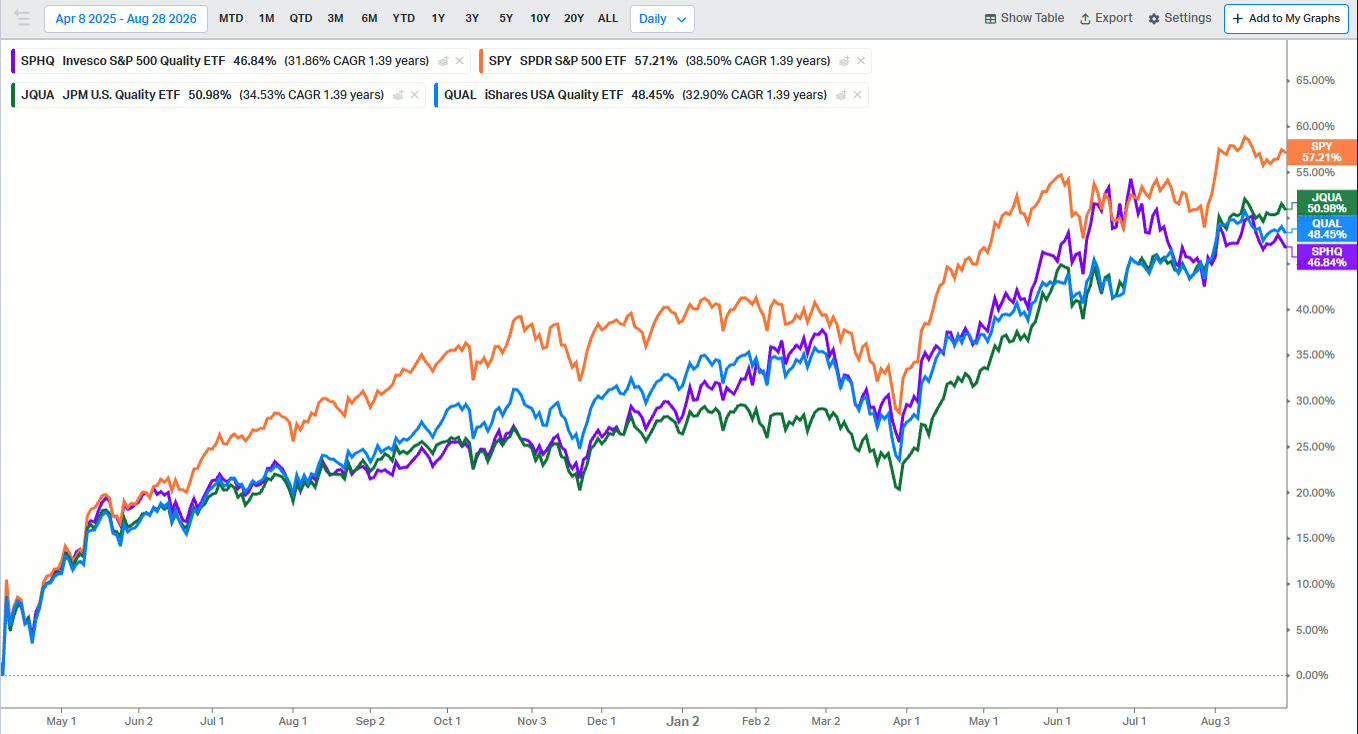
Since Liberation Day, all three quality ETFs trail SPY (orange).
Quality Lags in Euphoria, Then Leads When It Fades
The last time we saw something like this was 2009. SPHQ was the only one of these around then, and it massively trailed SPY in the early stage of the recovery.
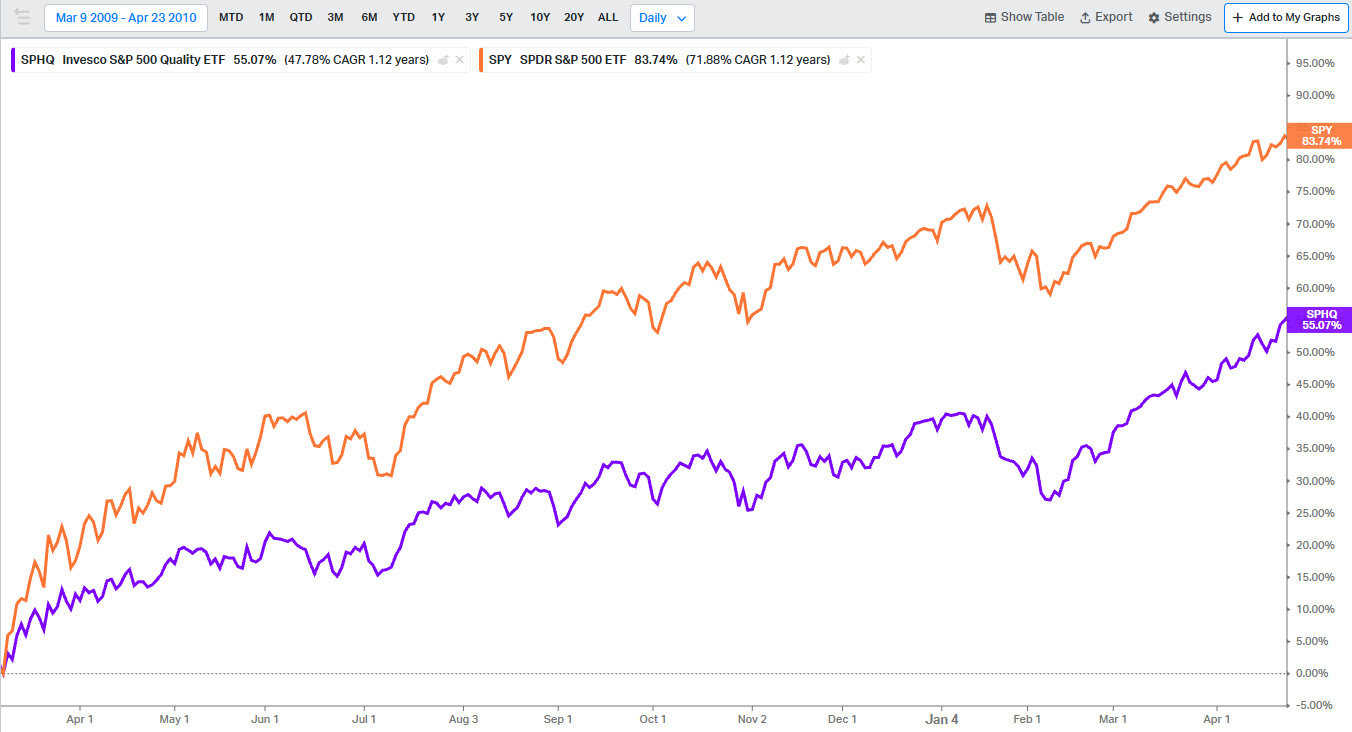
2009: SPHQ (purple) far behind SPY (orange) in the early recovery.
But as soon as the market wavered, high-quality companies made a comeback. Not all the way, but quality clearly beat the broader market as the euphoria gave way to fears of a “double-dip recession” in 2010 and then the European debt crisis in 2011. In fact, since that point in 2010, SPHQ has beaten SPY (start the clock before the 2008 crash, though, and it’s behind).
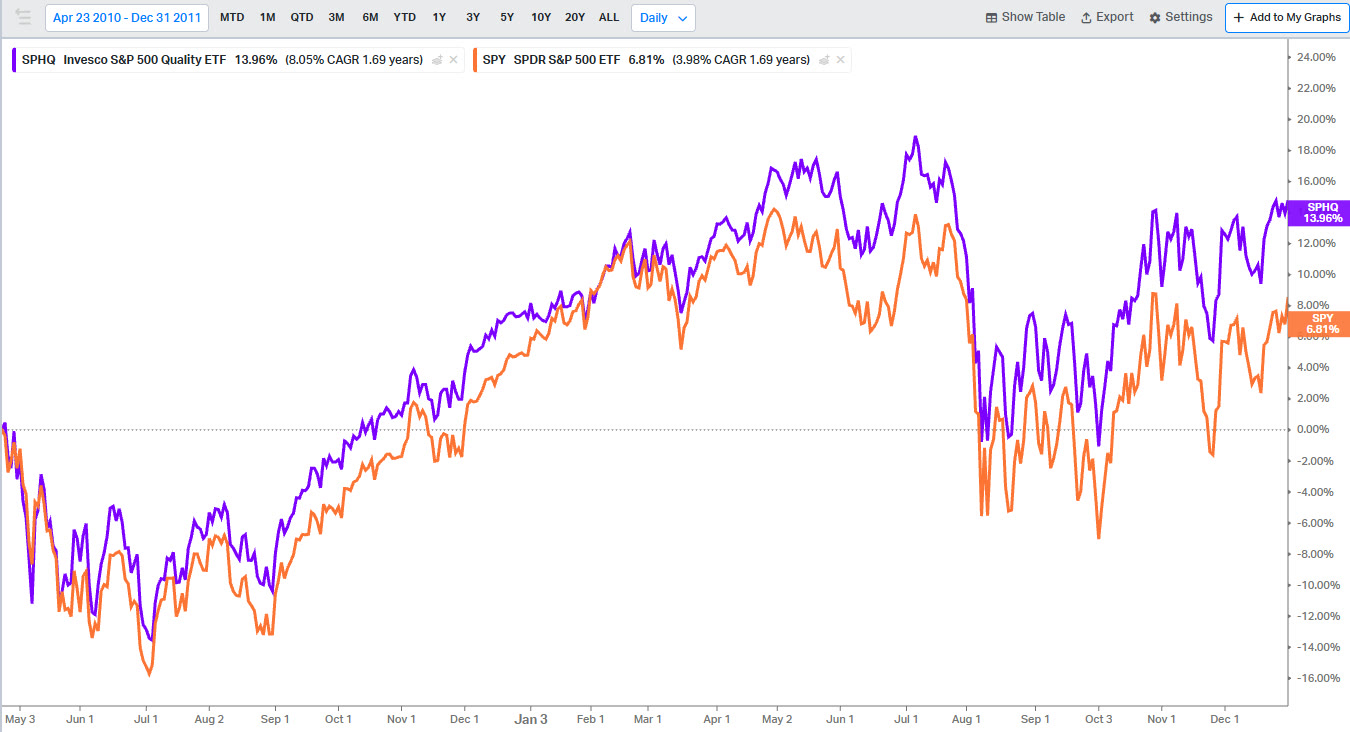
2010–2011: as the euphoria faded, quality (purple) pulled ahead.
Quality did especially poorly in the 2009 recovery and the Liberation Day recovery. In other recoveries it hasn’t been as extreme, but the pattern has been consistent. In 2020, it trailed the S&P through the recovery to the end of 2021…
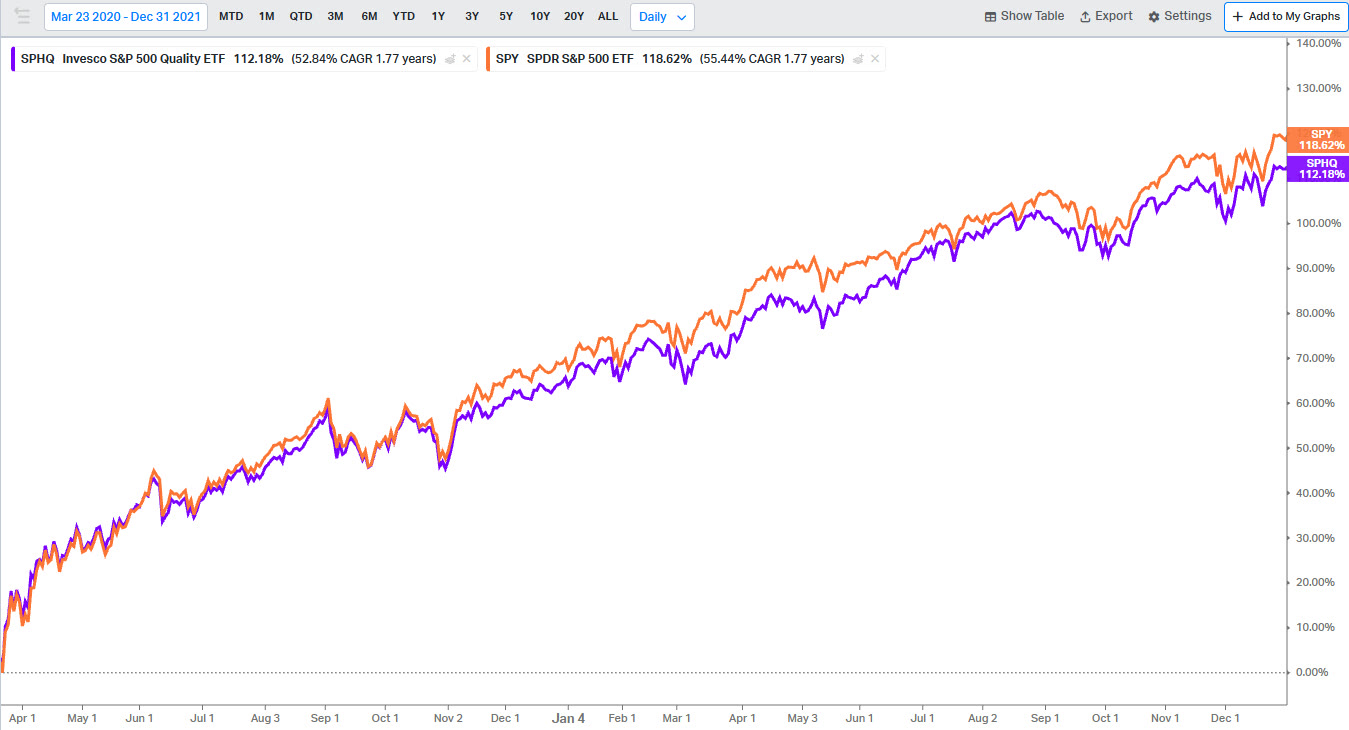
2020–2021: quality trails in the recovery.
…then beat it in 2022 as the euphoria wore off.
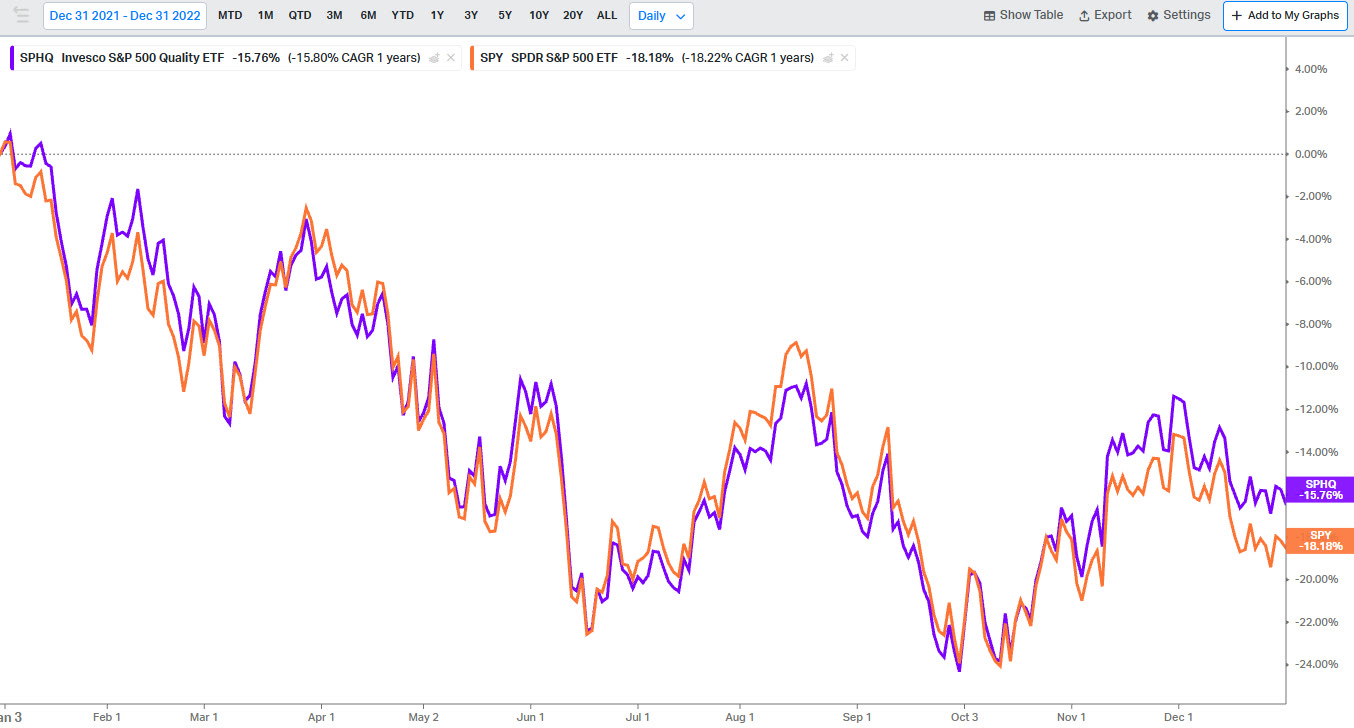
2022: quality (purple) holds up better as the euphoria fades.
Outside periods of euphoria (when quality usually trails) and the periods right after (when it tends to lead), quality’s return pattern isn’t that predictable. But I’m pretty sure we’re in a period of euphoria now, and quality has been lagging — which is why tactically minded investors may find quality ETFs worth a closer look.
A Better Way to Invest in Quality
That said, I don’t personally think screening for quality is the most effective way to invest in it. I prefer actively managed funds that build quality into their process. Funds like this one, which has absolutely decimated the Russell 1000 Growth index since it launched in 2000…
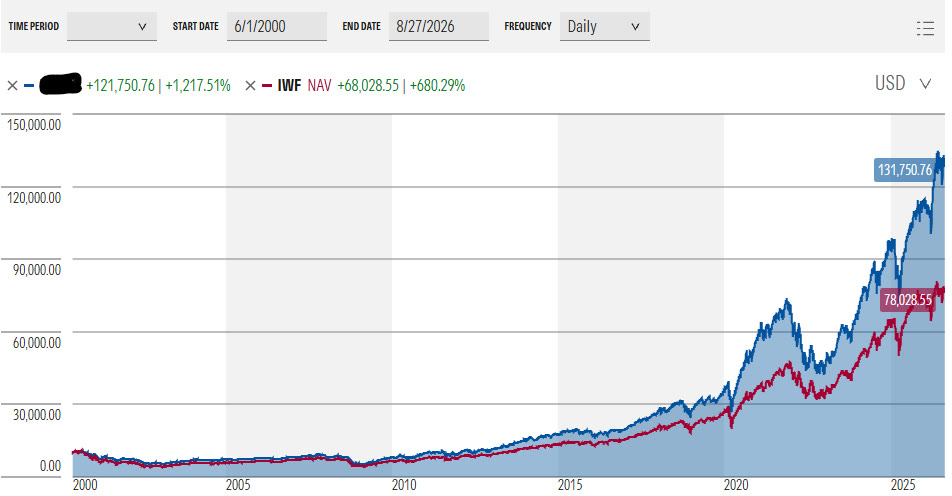
A quality-focused growth fund (blue) versus the Russell 1000 Growth (red) since 2000. Revealed in Part 9.
…or this one for international exposure, which has earned nearly twice the return of the main international index, the MSCI ACWI ex USA, since its 2011 inception.
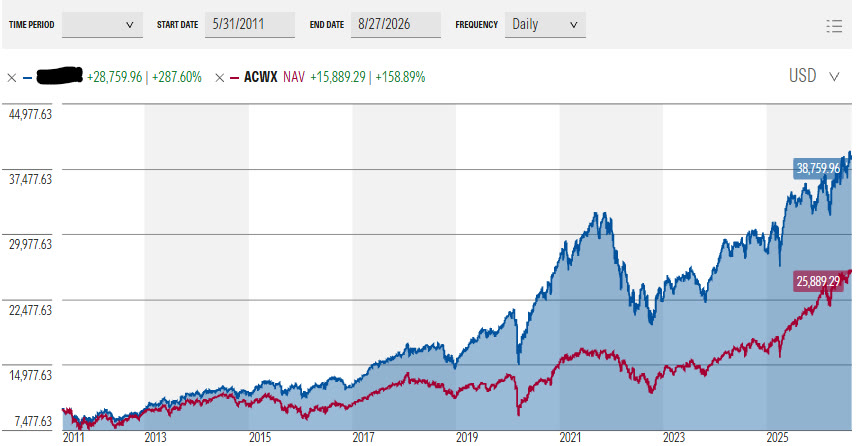
A quality-focused international fund (blue) versus the MSCI ACWI ex USA (red) since 2011. Revealed in Part 8.
The next two parts cover the top quality-oriented funds, international in Part 8 and U.S. in Part 9, including these two.
Watch the Full Video
Want to Go Deeper? In the Fundamentals of Finance Academy, Ethan breaks down funds and current market events on a live call every other week, and members get the full archive of recorded calls. Learn more about the Academy →
This article is for educational purposes only and is not investment advice. Ethan is a CFA charterholder, but nothing here is a recommendation to buy or sell any security, and it does not take your personal situation into account. Past performance does not guarantee future results. Charts of index returns are for illustration only and don’t reflect the fees, expenses or taxes of any actual investment. Performance data and fund details are as of 08/31/2026 and will change; check each fund’s website for current figures.
