JEPQ vs JEPI: Which Covered Call ETF Is Better?
About this article: This article is based on Ethan’s video, originally published on March 16, 2024. Because the written version was published later, returns, yields and fund details reflect data available at the time of the video and have likely changed since. Please check each fund’s website for current figures.
Who wins the battle for the best income ETF, JEPQ or JEPI? Both come from JPMorgan, both pay a big income check, and they get compared constantly. Here’s how they really differ.
The Short Version
Both are covered call ETFs: they own stocks and sell call options on them, trading most of their upside for income.
JEPQ almost always yields more (10.78% vs 8.50% at the time of the video), but that’s because it’s riskier, not better.
JEPQ loosely tracks the Nasdaq 100 and was over 40% tech. JEPI is managed as a lower-risk version of the S&P 500.
JEPI has held up much better in down markets. In my opinion, JEPI is the winner, though I’m not a fan of covered call ETFs in general.
How JEPQ and JEPI Are Similar
As a baseline, let’s briefly start with how they’re similar. Both of these are covered call ETFs. In a nutshell, a covered call ETF buys stocks, then writes, or sells, call options on them.
A call option gives the buyer the right to buy a stock at a set price. Of course, they’d only want to do that if the stock goes higher than that price. So if you’re selling those options, like these ETFs are, someone else gets to benefit from the upside in the stocks if they go up a lot.
To recap: they buy stocks, then sell call options on them. You get a little of the upside potential, but anything beyond that set price, called the strike price, you give up. And what do you get for giving up your upside? A big fat income check, and that is why people buy ETFs like JEPQ and JEPI. At the time of the video, JEPI was yielding 8.50% and JEPQ was yielding 10.78% (12-month rolling dividend yields, per JPMorgan).
Why JEPQ Yields More
So does that mean JEPQ is better? No. It will almost always have a higher yield, but that higher yield comes with higher risk.
You get some dividends from holding the stocks, but most of the income comes from selling the options. The more volatile the stocks are, and the more potential upside you’re giving up, the more income you’ll get from the options. That’s why JEPQ will normally have a higher yield: it’s riskier.
What’s Inside Each Fund
JEPQ’s stocks loosely track the Nasdaq 100. It’s not an exact replica, but it’s pretty close. That means it was over 40% in tech stocks, with a lot of exposure to just a few companies.
JEPI is actively managed and starts with the stocks in the S&P 500, but rather than try to mimic the index, it basically tries to create a lower-risk version of it. That’s important, because if you’re going to give up the upside potential, you want to be protected on the downside too.
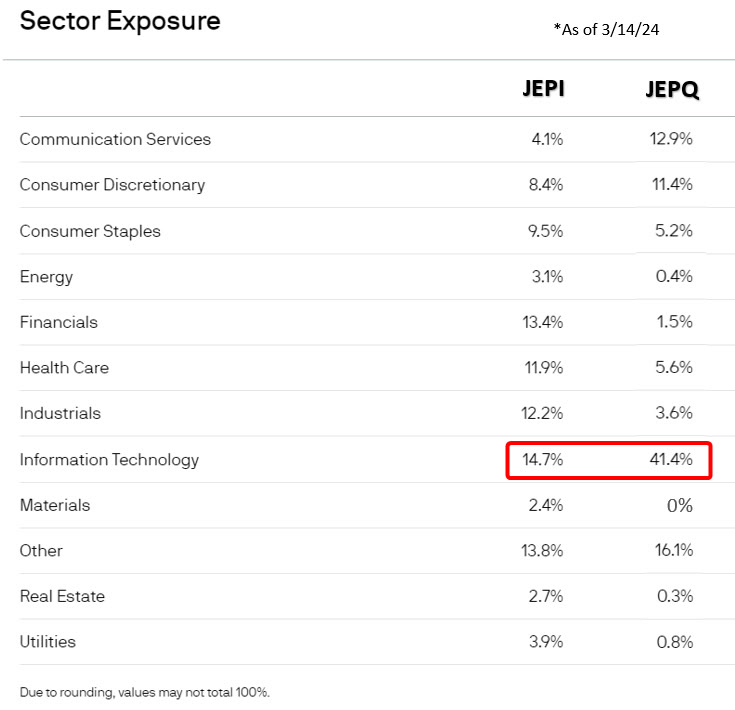
Sector exposure: tech was 14.7% of JEPI and 41.4% of JEPQ. Source: JPMorgan, as of 03/14/2024.
For example, JEPI has limits on how much can be in any one sector or company. That helps lower the risk, because the more exposed you are to one thing, the more at risk you are if something goes wrong. If interest rates went up, or there was a new wave of tech regulation, or a trade war hit the supply of key materials for tech companies, that would likely hurt JEPQ more than JEPI.
More Income Means More Risk
That brings us to another key point. More risk gets you higher income, but it also gets you… well, more risk.
When you sell a call option, you give up your upside potential, but you keep all the downside potential. The ETFs own the stocks, so if the stocks go down, the ETFs go down just as much. The only difference is whatever they collect from the option income.
Here’s where JEPI and JEPQ are really set apart. Neither has that much upside potential, because they’re both selling call options that give away most of it. JEPQ has a little more upside when tech stocks are doing well, but long-term growth isn’t the main reason to own either of these.
On the other hand, JEPQ has much more downside potential, because it’s so much more exposed to one sector and a small handful of companies, and it’s not managed to limit downside risk the way JEPI is.
How They’ve Performed
This chart illustrates that risk/reward trade-off perfectly. In the first few months after JEPQ launched, it fell almost 15%. JEPI only fell about 7.5%, and by late December 2022, JEPQ was down more than 12% while JEPI was up more than 1%. In a down market, especially one where tech does poorly, JEPI should be expected to hold up better than JEPQ.
However, you can also see that JEPQ recovered more strongly in 2023, as tech stocks rallied on AI optimism and the expectation of falling interest rates.
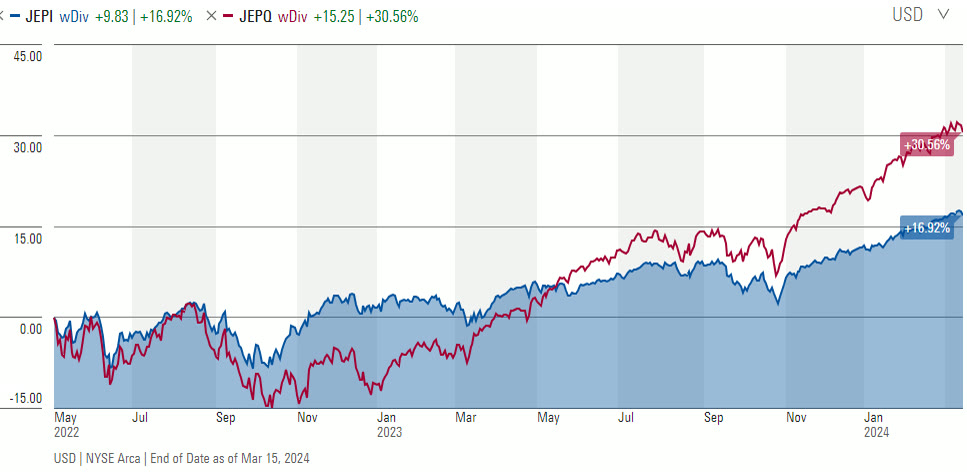
JEPI (blue) versus JEPQ (red) since JEPQ’s May 2022 launch, with dividends. Source: Morningstar, as of 03/15/2024.
If we swap in the regular index funds without covered calls, QQQ for the Nasdaq 100 (red), which is what JEPQ is most similar to, and SPY for the S&P 500 (blue), which is what JEPI is most similar to, we get an even better sense of how these ETFs behave in different markets.
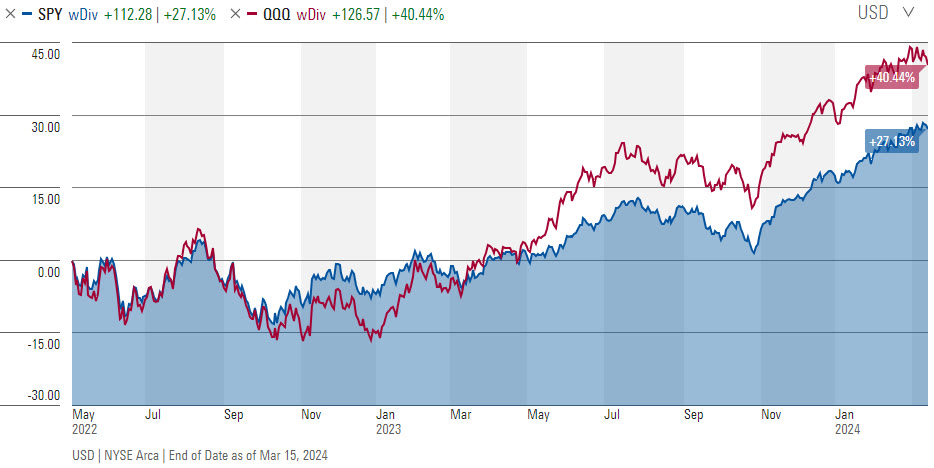
SPY (blue) versus QQQ (red) over the same period, with dividends. Source: Morningstar, as of 03/15/2024.
QQQ fell a little over 15% by its low point in October 2022. JEPQ fell a little under 15%, so it really didn’t offer much downside protection. By contrast, SPY fell about 13%, and JEPI fell only about 7.5%.
The downside protection was better with JEPI, which is what I would expect most of the time, since it’s managed more for that purpose and isn’t so concentrated in tech stocks.
This next part is important. See how QQQ has pulled ahead of SPY? A lot of people see that JEPQ has beaten JEPI and say things like “JEPI’s growth can’t compete with JEPQ’s.” That’s true if tech is beating every other sector, like it had been lately. But if it’s not, JEPI could definitely beat JEPQ.
In the end, both ETFs trailed their non-covered-call cousins by about 10% since JEPQ’s inception. That’s a total coincidence.
Taxes: Both Use ELNs
Both funds are managed using equity-linked notes, or ELNs. They make the stocks more tax efficient, but the option income less tax efficient.
My Verdict
JEPI offered more downside protection than JEPQ, which is likely to happen most of the time. JEPQ offered more upside than JEPI, which will probably happen more often than not, but if tech stocks fall out of favor, JEPI could do better, even in an up market.
Personally, I’m not a fan of covered call ETFs in general. I think giving up most of your upside potential while keeping most of your downside potential is not a good deal for investors in the long run.
However, JEPI’s lower-volatility approach makes it a little more attractive as a piece of a portfolio, for investors who want a higher-income, lower-risk version of the U.S. stock market. From the beginning of 2022 to its lowest point that October, JEPI fell only about half as much as the S&P 500.
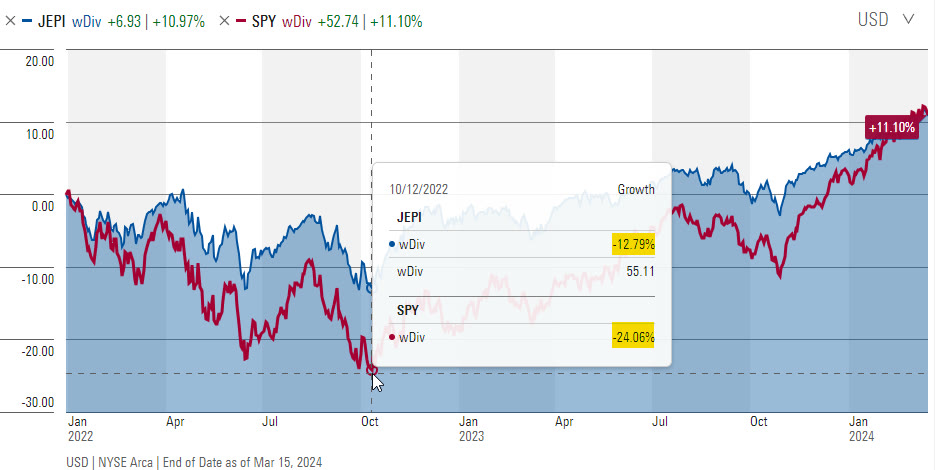
From the start of 2022 to the October 12, 2022 low: JEPI (blue) down 12.79%, SPY (red) down 24.06%, with dividends. Source: Morningstar, as of 03/15/2024.
JEPQ hasn’t been around for any downturn as big as that one, but in the few we can look at, it hasn’t shown the ability to protect on the downside nearly as well. That makes sense, because JEPI is managed specifically to limit the downside, while JEPQ is not.
Everyone’s situation is different, so this isn’t advice. But since there’s almost no scenario in which I’d buy JEPQ, and I could make the case for JEPI, in my opinion, JEPI is the winner.
For younger investors who want more long-term growth potential, I think anything that sells covered calls is likely to underperform its counterpart without covered calls in the long run.
For a closer look at each fund, read JEPQ ETF Explained and How to Use JEPI in a Portfolio.
Watch the Full Video
Want to Go Deeper? In the Fundamentals of Finance Academy, Ethan breaks down funds and current market events on a live call every other week, and members get the full archive of recorded calls. Learn more about the Academy →
This article is for educational purposes only and is not investment advice. Ethan is a CFA charterholder, but nothing here is a recommendation to buy or sell any security, and it does not take your personal situation into account. Past performance does not guarantee future results. Charts of index returns are for illustration only and don’t reflect the fees, expenses or taxes of any actual investment. Performance data and fund details are as of 03/15/2024 and will change; check each fund’s website for current figures.
