JEPQ ETF Explained: What the JPMorgan Nasdaq Equity Premium Income ETF Really Gives You
About this article: This article is based on Ethan’s video, originally published on March 12, 2024. Because the written version was published later, returns, yields and fund details reflect data available at the time of the video and have likely changed since. Please check each fund’s website for current figures.
Is JEPQ, the JPMorgan Nasdaq Equity Premium Income ETF, a good buy? I used to help financial advisors build portfolios for their clients, and this is exactly the kind of question I’d get from them. Here’s my take.
The Short Version
JEPQ is, for practical purposes, a covered call ETF on the Nasdaq 100: it owns the stocks and sells call options on them for income.
Its upside is capped at roughly 2.5% a month plus the option income. Its downside is not capped, only cushioned by about 1% a month.
Since launch it trailed QQQ by over 12%, and by over 20% from the start of 2023. A similar fund, QYLD, trailed QQQ by more than 300% over 10 years.
It works best if the Nasdaq stays flat. I don’t expect that, so I don’t find JEPQ especially attractive.
How JEPQ Works
In a nutshell, JEPQ is a covered call ETF on the Nasdaq 100. There are a couple of slight differences, which I’ll cover at the end, but for simplicity, that’s what it is.
Covered call ETFs generally have two parts. They buy stocks that track an underlying index, then sell call options on them to generate income. When the underlying stocks are really volatile, like the Nasdaq 100, that income can be really high. That’s the main appeal.
There’s just one problem. Investing in JEPQ without considering the many ways it can go wrong is like taking a loan from a mobster without considering the many ways that can go wrong. That juicy income payment comes with a hefty price, and unfortunately a lot of people who tout JEPQ don’t understand how it actually works.
Myth: JEPQ Gives You Maximum Exposure to AI
I’ve heard JEPQ pitched as a way to get maximum exposure to the growth of AI. It definitely won’t.
When you sell a call option on a stock, you give up any upside beyond the strike price. JEPQ usually caps its upside at about 2.5% a month, plus the option income. That’s nowhere close to maximum exposure. It’s actually far less exposure to AI than a regular Nasdaq 100 ETF, and the Nasdaq 100 isn’t even focused on AI; it just has more tech than most indexes.
So your upside is capped. What about the downside? It isn’t. It’s cushioned a little by the option income, but that’s only around 1% a month. Beyond that, you get all the downside of the underlying stocks.
How That Played Out in Practice
JEPQ hasn’t been around long, and a lot of people see a 34% return in less than two years and think, “Wow, that’s pretty good!”
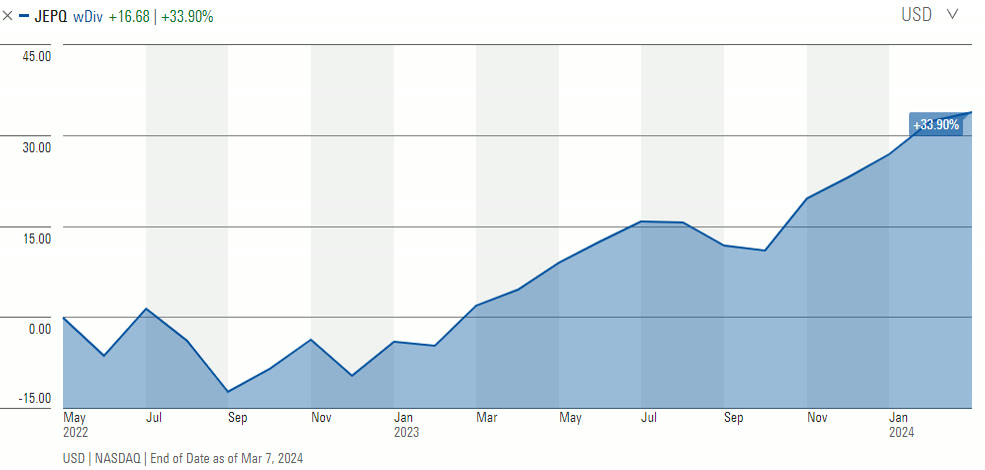
JEPQ since its May 2022 launch: about a 34% total return.
Compare it with the regular Nasdaq 100 ETF, QQQ, and it trailed by over 12% in less than two years. And that period started with a lot of downside, which favors JEPQ.
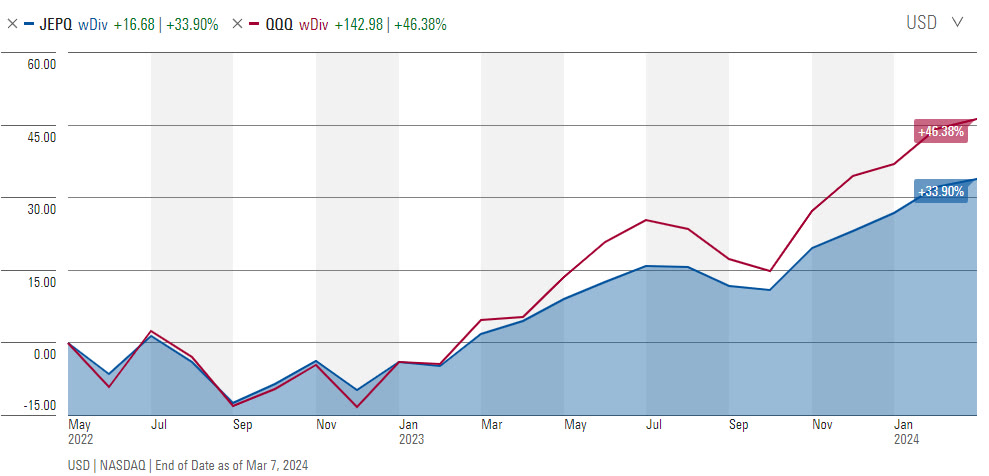
JEPQ (blue) versus QQQ (red) since JEPQ’s launch.
Start the clock at the beginning of 2023 instead, and it trailed QQQ by over 20% in barely more than a year. That’s not maximum upside, and over a long period the gap can add up massively.
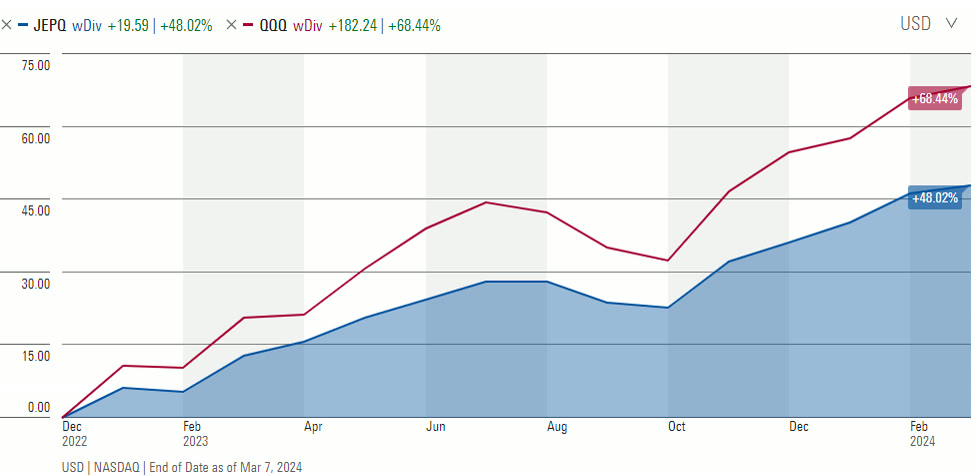
From the start of 2023: JEPQ (blue) trails QQQ (red) by more than 20%.
For a longer view, look at another Nasdaq 100 covered call ETF, QYLD. Over 10 years, it trailed QQQ by more than 300%.
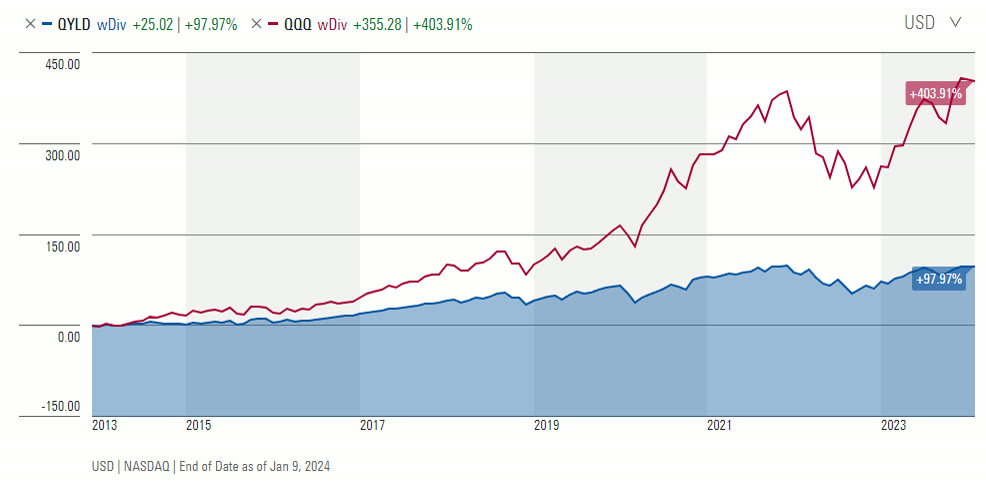
QYLD (blue), another Nasdaq 100 covered call ETF, versus QQQ (red) over 10 years.
A Tiny Amount of Downside Protection
And what do you get for giving up most of your upside? A tiny amount of downside protection. In the first five or so weeks after JEPQ launched, it beat QQQ, but it still fell over 11% in a few weeks. That’s not what I’d call safe.
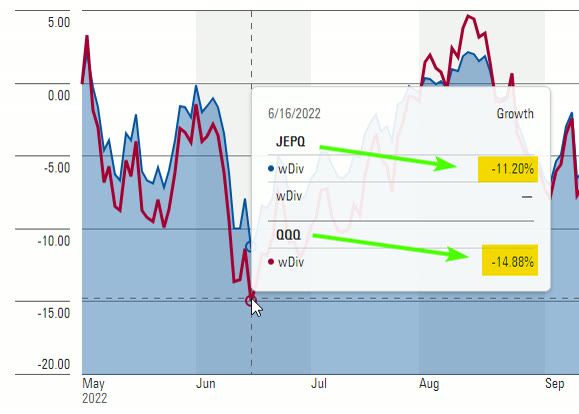
The first weeks after launch: JEPQ fell 11.2% versus 14.1% for QQQ.
When JEPQ Would Do Well
The scenario where JEPQ should shine is a relatively flat Nasdaq 100. You’d collect the option income, you wouldn’t miss much upside, and you wouldn’t lose much on the downside. Do you expect the Nasdaq, which is about 50% tech, to stay flat? I certainly don’t. For that reason, I don’t consider JEPQ a particularly attractive investment.
Two Things That Set JEPQ Apart
If you’re still considering it, there are two ways JEPQ differs from a typical Nasdaq 100 covered call ETF:
It’s actively managed. The stock portfolio tries to stay close to the Nasdaq 100, but it doesn’t track it as precisely as an index fund.
It uses equity-linked notes (ELNs) instead of selling calls directly. ELNs mimic the returns of call options, but they change the tax treatment: the option income is taxed as ordinary interest income rather than capital gains. The stock gains get more favorable treatment, but since most of JEPQ’s return usually comes from the option income, that’s likely a net negative in a lot of cases.
One more thing to keep in mind: JEPQ’s short track record lined up with a period of high volatility, which pushes option income up. Its history may make the income look more reliable than it will be in calmer markets.
For a deeper look at how JEPQ compares with its newer rivals, read JEPQ vs GPIQ vs QQQI.
Watch the Full Video
Want to Go Deeper? In the Fundamentals of Finance Academy, Ethan breaks down funds and current market events on a live call every other week, and members get the full archive of recorded calls. Learn more about the Academy →
This article is for educational purposes only and is not investment advice. Ethan is a CFA charterholder, but nothing here is a recommendation to buy or sell any security, and it does not take your personal situation into account. Past performance does not guarantee future results. Charts of index returns are for illustration only and don’t reflect the fees, expenses or taxes of any actual investment. Performance data and fund details are as of 03/12/2024 and will change; check each fund’s website for current figures.
