SPMO Revisited: A CFA Charterholder Answers the Critics of His First SPMO Review
About this article: This article is based on Ethan’s video, originally published on May 17, 2026. Because the written version was published later, returns, yields and fund details reflect data available at the time of the video and have likely changed since. Please check each fund’s website for current figures.
My first review of SPMO, the Invesco S&P 500 Momentum ETF, drew a lot of pushback, and it’s clear I didn’t explain myself well enough to many of the 42,000 people who watched it. My goal is to help people understand investing the way very few do, so in this follow-up I’ll respond to the most common criticisms and try to do a better job.
New here? Start with the original: SPMO ETF Review.
The Short Version
I never said SPMO would fall. I said it would keep working until market leadership changed, and that I couldn’t say when that would happen.
In the one real sell-off since (the DeepSeek scare and the 2025 tariff drop), SPMO did not protect investors. It trailed the S&P 500 by almost 3%.
The S&P 500 is at record concentration, and SPMO is even more concentrated, with over a third of its assets in four AI-linked companies.
Momentum has lagged in up years too, whenever leadership reversed. SPMO will work until it doesn’t.
“You Got It Wrong. SPMO Has Only Gone Up.”
This was one of the most popular comments. And yes, SPMO has gone up since the first review came out on November 21, 2024, after first dropping about 13%.
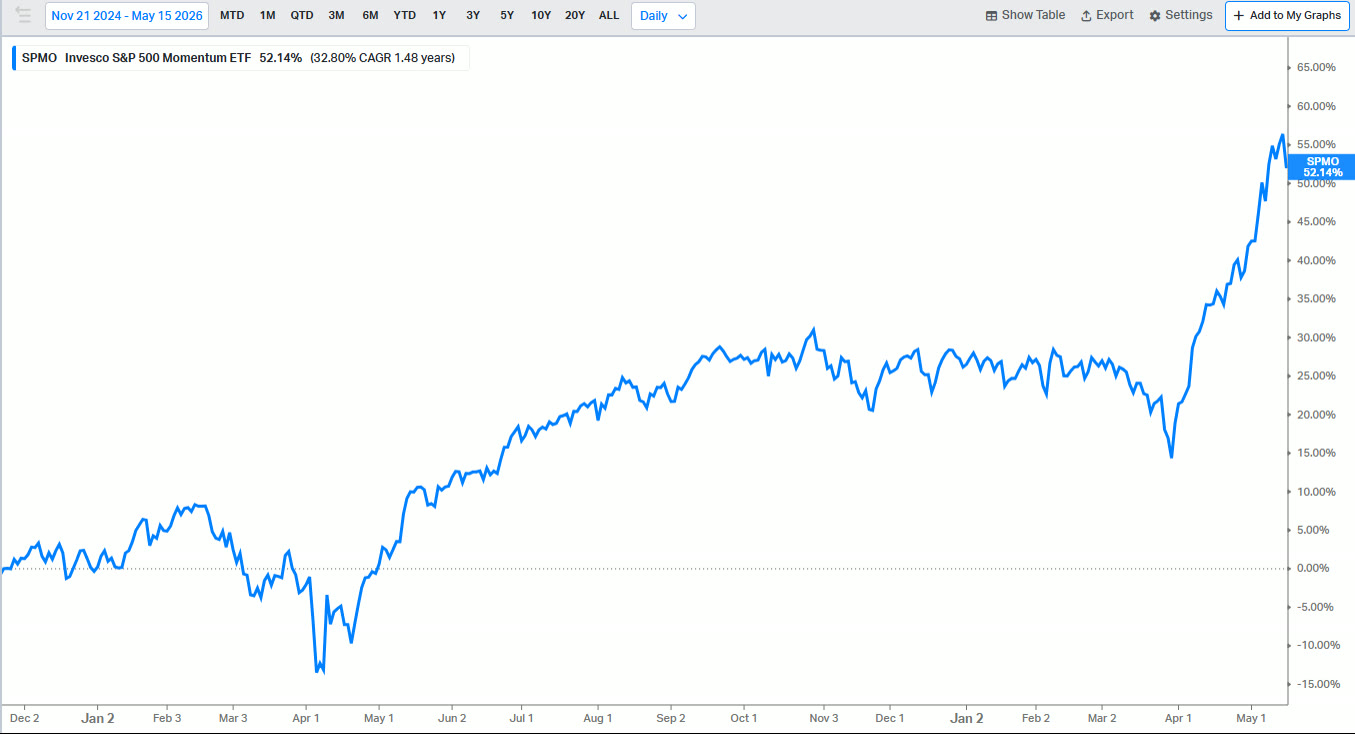
SPMO since the original review in November 2024.
But I never said it would go down. What I said was that I couldn’t say when the market would turn, and that SPMO would probably keep working until it did.
Where some of the confusion may have come from: I did say I wouldn’t expect SPMO to protect you on the downside. We haven’t had a major downturn since, but in the biggest one we did have, the DeepSeek scare and the “Liberation Day” tariff sell-off, SPMO didn’t protect investors. It trailed the S&P 500 by almost 3% in about a month and a half.
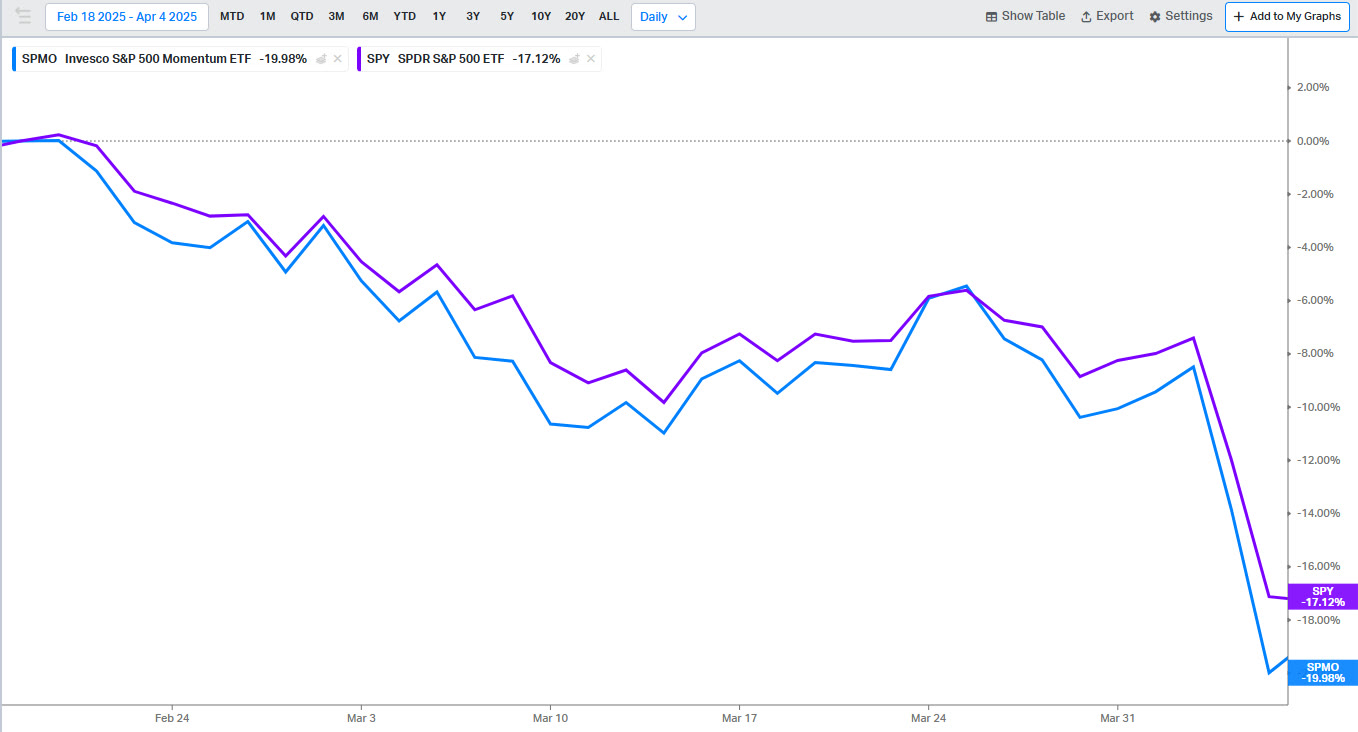
The early 2025 sell-off: SPMO (blue) fell further than the S&P 500 (purple).
And when I said SPMO would do well “until the market turned,” I meant until a different part of the market started leading. I was talking about SPMO’s performance relative to the S&P 500, not whether it would rise or fall in absolute terms.
“All the Trailing Returns Are Green”
Of course they are. The S&P 500 just had one of its best two-year stretches ever. But those who don’t know history are doomed to repeat it. Over the past 100 years, the S&P 500 has returned more than 25% two years in a row five times:
The 1920s: a bubble, followed by four straight down years and the Great Depression.
The 1930s: followed by another significant downturn.
The 1950s: followed by one modest year, then a downturn.
The 1990s: another bubble, followed by one more positive year and then a severe downturn.
2023 and 2024: and we’ve since had another strong year and a half.
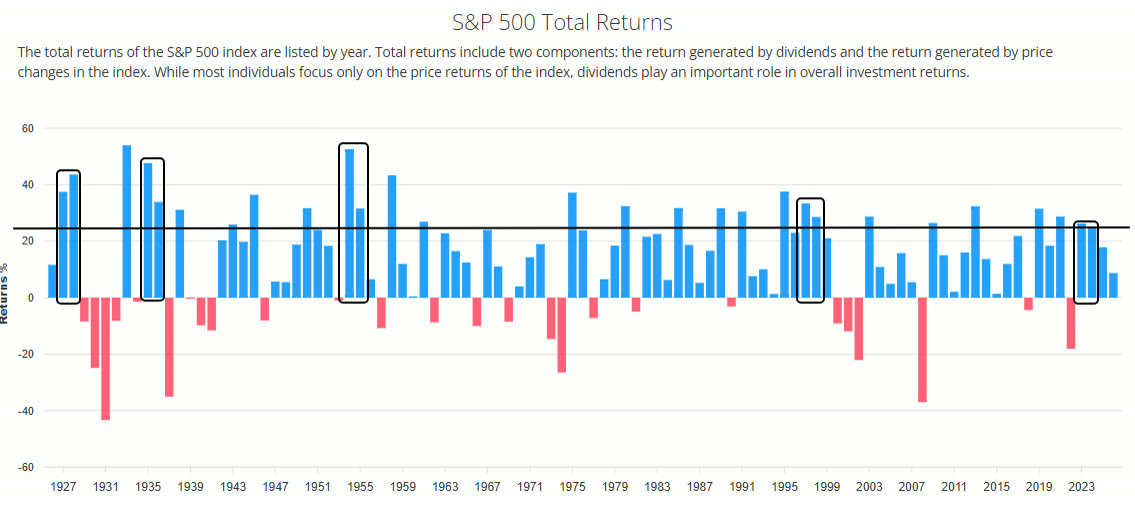
S&P 500 total returns by year, with the back-to-back 25%+ years marked.
I’m not making a short-term market call. But if that doesn’t tell you the party could end at some point, I don’t know what would.
Why Concentration Is the Real Issue
The types of companies that lead on the way up usually lead on the way down too. But a downturn isn’t required for SPMO to lose steam relative to the S&P 500, which is what I was trying to explain the first time. SPMO is a subset of the S&P 500, so in general it will rise when the S&P rises and fall when it falls. The question is whether it beats it.
Today the S&P 500 is at a record level of concentration, with over 40% of its assets in just 10 stocks, and almost all of them have futures tied heavily to AI.
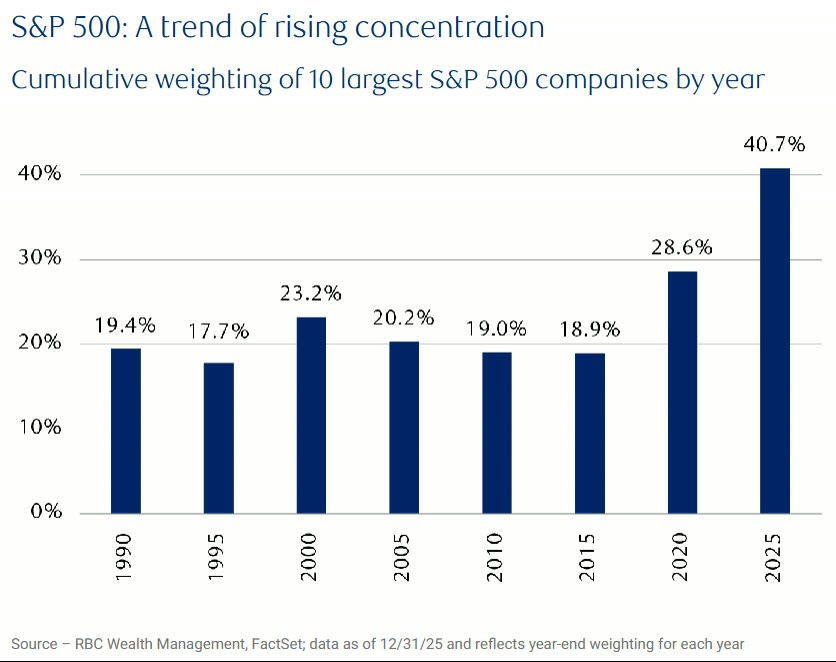
The 10 largest S&P 500 companies now make up about 41% of the index. Source: RBC Wealth Management, FactSet.
SPMO is even more concentrated: over 50% of its assets in its top 10 holdings, 49% in tech, and over a third in just four AI companies: NVIDIA, Broadcom, Micron and Alphabet. If you think that will work out forever, you don’t understand how investing, or momentum investing, works.
As I said in the first review, every factor has added value over long periods, but none add value all the time. Momentum tends to do well in long expansions and poorly in market reversals, and pairing it with value or dividend strategies has historically helped in its worst years.
“SPMO Beats the Market When It’s Up and Loses Less When It’s Down”
Another commenter put it this way: “It’s not that deep bud, SPMO will continue to outperform the S&P 500 the majority of the time, getting significantly better returns when the market is up and also losing less money when the market is down.”
Unfortunately, investing is deeper than that. If there were a simple way to get significantly better returns on the upside and lose less on the downside, everyone would do it. It doesn’t exist. We’ve already seen SPMO fail to protect in the recent downturn. And does it always do significantly better when the market is up? Look at the momentum factor (blue) in this table of factor returns:
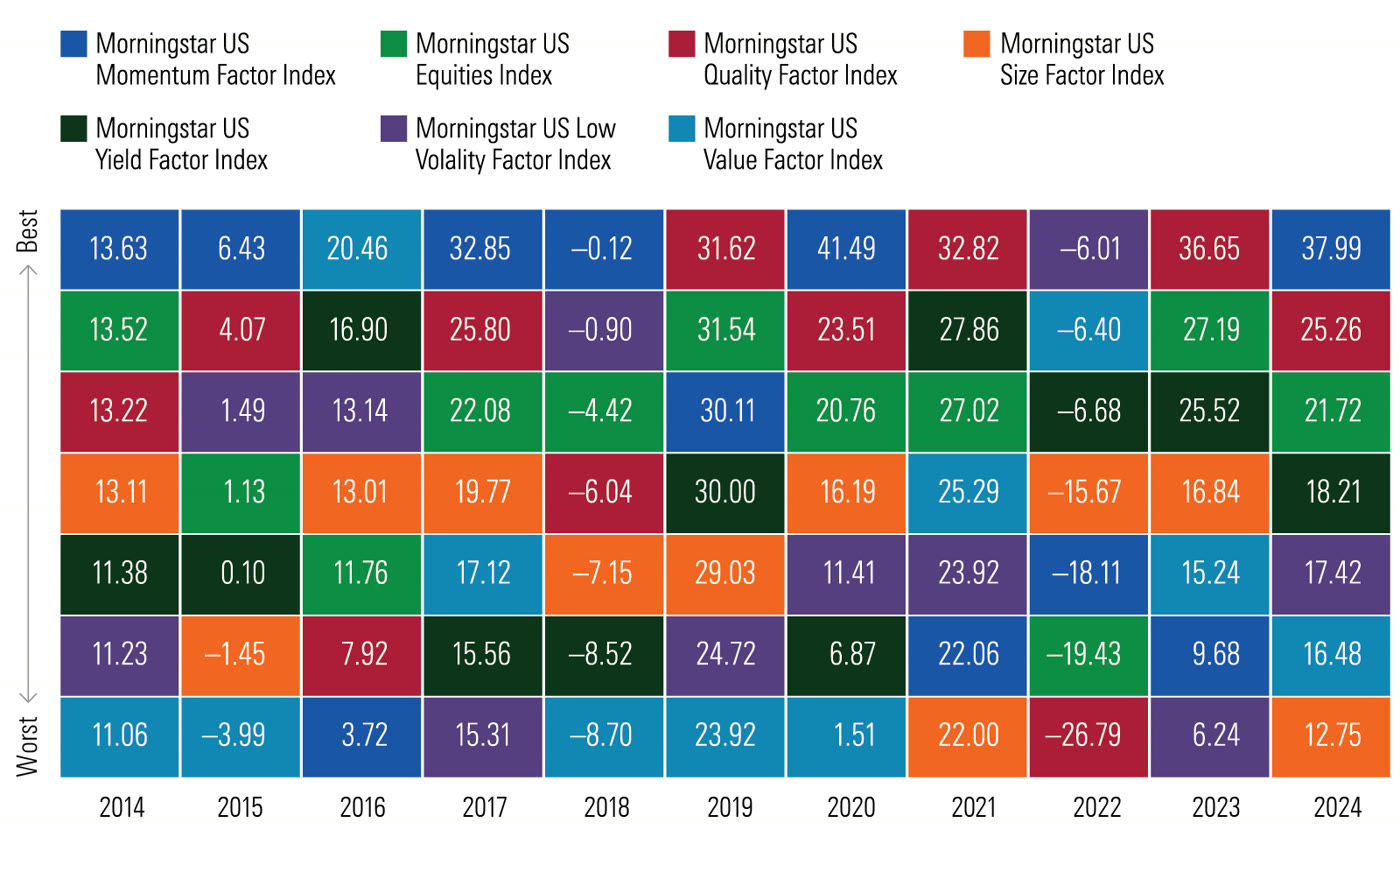
Morningstar US factor index returns by year, 2014–2024. Momentum is in blue.
2016 was an up year, but it was a market reversal where value led, and momentum lagged.
2021 was an up year, but rates started rising late in the year, leadership reversed, and momentum lagged.
2023 was an up year, but tech and growth roared back after a 2022 led by low-volatility value stocks, and momentum lagged.
So no, I don’t think I was wrong. (And nothing on this channel should ever be taken as advice.) What I tried to explain is that momentum struggles in market reversals.
Has the Reversal Happened Yet?
In the 10 years before the first review, SPMO had done great, but almost all of its excess return came after mid-2023. Tech had kept leading since the end of 2022, SPMO adjusted to that, and the narrow leadership continued.
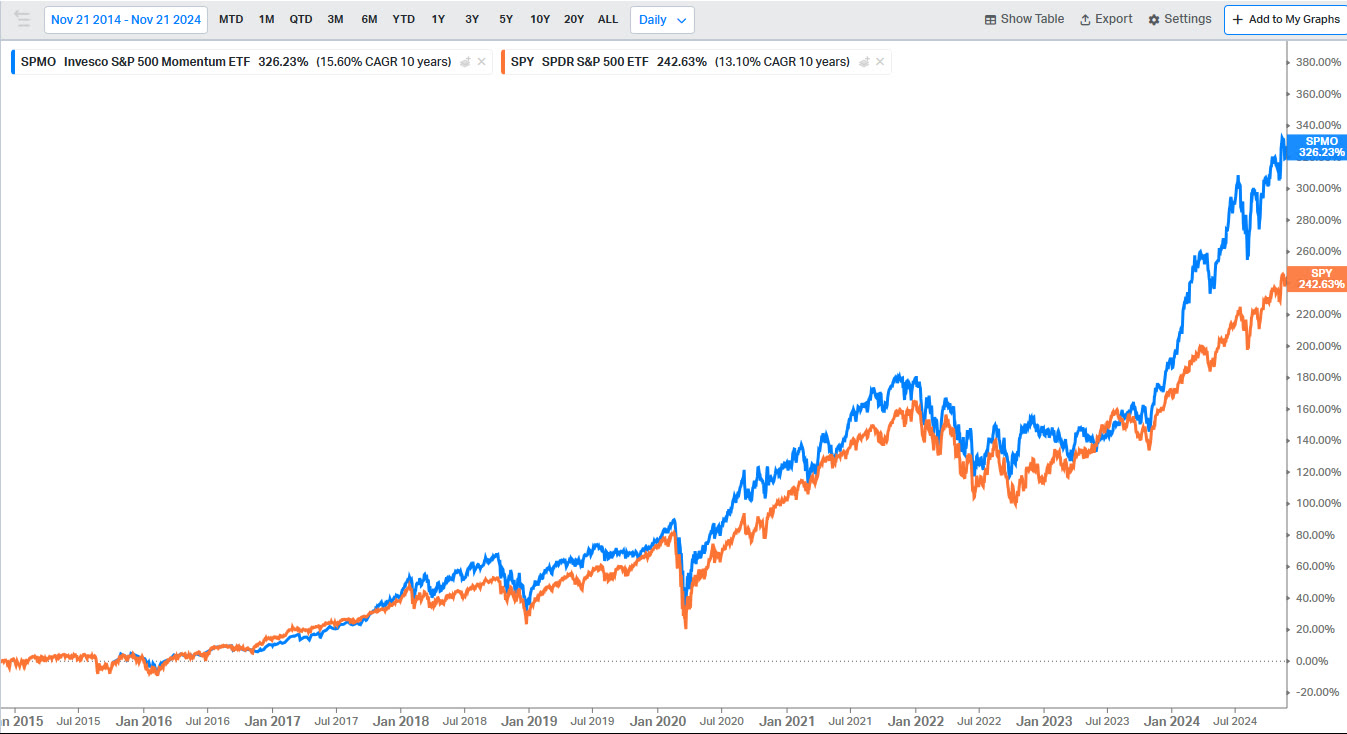
The 10 years before the first review: SPMO (blue) versus the S&P 500 (orange). Most of the gap opened after mid-2023.
Has that narrow tech leadership stopped? No. We hit peak market concentration at the end of 2025. And on a rolling one-year basis, tech has kept leading the S&P 500 nearly the whole time, except early 2025, which is exactly when SPMO trailed.
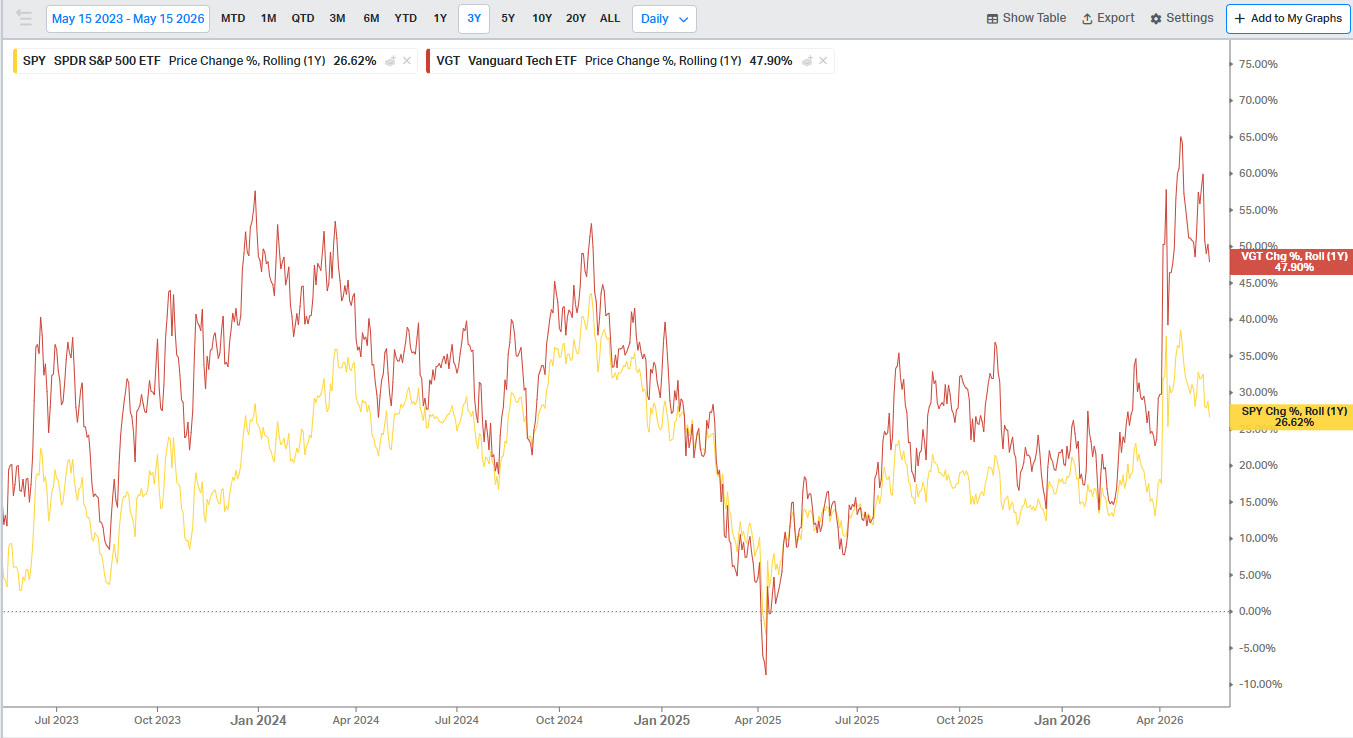
Rolling one-year returns: the Vanguard tech ETF (red) versus the S&P 500 (yellow).
Fortunately for SPMO investors, tech kept leading, so SPMO kept doing well. I didn’t say a reversal was imminent. I said one is likely at some point, that SPMO is unlikely to do well when it comes, and that after a few strong years for momentum a reversal becomes more likely, though I couldn’t predict exactly when.
The Bottom Line
I’m not anti-momentum or anti-SPMO. Momentum is one of the factors that has added value over long periods. What I’m against is blindly assuming that whatever has done well recently will always do well. That’s one of the most common mistakes investors make, and hundreds of years of market history show it doesn’t work in the long run.
As long as the same stocks keep leading, SPMO will probably keep beating the S&P 500. I just don’t think it’s reasonable to expect the party to last forever, because in investing it never does. SPMO will work until it doesn’t. I’m not telling you what to do; I’m trying to help you understand how it works so you can make more informed decisions.
For more on how SPMO compares with the other big momentum ETF, read SPMO vs MTUM.
Watch the Full Video
Want to Go Deeper? In the Fundamentals of Finance Academy, Ethan breaks down funds and current market events on a live call every other week, and members get the full archive of recorded calls. Learn more about the Academy →

This article is for educational purposes only and is not investment advice. Ethan is a CFA charterholder, but nothing here is a recommendation to buy or sell any security, and it does not take your personal situation into account. Past performance does not guarantee future results. Charts of index returns are for illustration only and don’t reflect the fees, expenses or taxes of any actual investment. Performance data and fund details are as of 05/17/2026 and will change; check each fund’s website for current figures.
